Tuesday, December 18, 2012

Review and Forecast: 12/12H, 12/14L, 12/19H

From the 12/11/12 Daily nightly Email: "We have rallied into the LT geometric 12/10-12 CIT, at the 12/11 SPX Apex C, making a 12/11-12H. There are good odds that we should be lower no later than 12/13. We should see a decline into the next 12/16 weekend Solar CIT, ie 12/14-17L."

Actual: We rallied into the 12/12 right into the FED announcement High and saw a sharp decline into 12/14 NDX Apex and into 12/16 weekend Solar CIT Low at the close.


Long term (LT) geometric Time CITs
 
6/1/12 was a rare 3 long term geometric SPX CITs (Change in Trend), covering Decades, all clustering on one date, Friday 6/1/12, which became the Monday 6/4/12 Major Low right at the Open.


9/13/12  LT CIT was the 9/14 major High


9/27-28 double LT CIT was the 9/26 Major Low


12/10-12 double LT CIT was the 12/12 High


What is next? We should see some volatile moves in the next few weeks and months. 

Shorter term, from the 12/14 Apex and Solar CIT Low, we should rally into the 12/19 geometric CIT High +/-1.  12/18 +/- 1 is also the next 6 LM Cycle CIT (see previous post).

The last time we had an important Mayan Date was the Harmonic Convergence of 8/16/1987, 1 week before the major 8/25/87 High and 2 months before the markets crashed.

The next important Mayan date is on 12/21/12, which is based on a long term 26000 year cycle.


We should see a Major High, but not until my next long term CIT is due
We should see a sharp decline afterwards.

Monday, December 17, 2012

12/21/12 Mayan Calendar: Dawn of a new Age

12/21/12 Mayan Calendar: Dawn of a new Age

http://www.manataka.org/page1578.html


"They say that the world will end in December 2012. The Mayan elders are angry with this. The world will not end. It will be transformed."

"At sunrise on December 21, 2012 for the first time in 26,000 years the Sun rises to conjunct the intersection of the Milky Way and the plane of the ecliptic. We are at the cusp of the era when peace begins, and people live in harmony with Mother Earth."

"Mayan Daykeepers view the Dec. 21, 2012 date as a rebirth, the start of the World of the Fifth Sun."

"We are living in the most important era of the Mayan calendars and prophecies. All the prophecies of the world, all the traditions, are converging now. There is no time for games. The spiritual ideal of this era is action. Many powerful souls have reincarnated in this era, with a lot of power. This is true on both sides, the light and the dark. High magic is at work on both sides."


"And I would like to say that according to the Mayan Calendar the 21st of December marks the end of the Macha and the beginning of the Pacha. It is the end of selfishness and the beginning of brotherhood. It is the end of individualism and the beginning of collectivism... the 21st December this year. The scientists know very well that this marks the end of an anthropocentric, and the beginning of a biocentric life. It is the end of hatred and the beginning of love. The end of lies and the beginning of Truth. It is the end of sadness and the beginning of joy. It is the end of division and the beginning of joy. This is a theme to be developed, that is why... we invite you, those who bet on mankind we invite those who want to share their instances for the good of mankind."
~Evo Morales, President of Bolivia at the UN General Assembly 67th season.
"On 21 December, in one week, eight thousand+ advanced TM meditators (TM Sidha's) from local schools will come together at the holy gathering of the Mayan, Mixtec, Zapotec and other tribes to be held at Monte Alban in southern Mexico.  These people are all members of Solar traditions, all the way to Ecuador and Peru. The awakening of their culture through transcending and the advanced techniques of Transcendental Meditation, connecting with the deep culture in accord with Natural law, is happening in exactly those countries connected with this culture."

Friday, December 7, 2012

Cycle Review and 6 Lunar Month Cycle Update

From 12/1 weekend email: "We rallied into the Friday 11/30 Solar CIT and into 12/2 is the midpoint of JuR &JuD CIT and 12/3 CIT, suggesting a 11/30-12/3 High and turn lower. There are some cycles, like the 55 TD Inverse & 16 TD suggesting a 12/5L"
 
Actual:
The Friday 11/30 Solar CIT, 12/2 MP Ju & Monday 12/3 geometric CIT was a Monday 12/3 High right at the Open and have reversed lower into 12/5 Low of the week, which was a VIX CIT.


On 12/5, I posted the intraday Times and Cycles  for 12/5 on the T&C Forum:


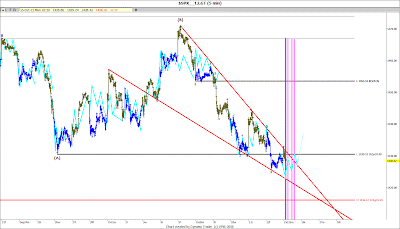
Intraday 5 min SPX CIT Times 12/05/12:  10.55, 3.20 pm Eastern
Intraday Cycle is the Cyan lines: (9.40H), 10.30L, 12.45H, 1.40L, 3.30H


Actual: The 10.55 pm CIT (pink vertical Line)was a Bullseye Low. We rallied 18 SP's off the Low into the 3.20 CIT High The intraday cycle was followed near perfection.

On 12/5 I updated clients: "Cycles were looking for a 12/5 Low and a rally into 12/10 High"

Below is one of the simple "secret" cycles I continue to use, but remember to use them in confluence with many other Time and Cycle techniques for improved accuracy.  I first mentioned the 6 Lunar Month Cycle a month ago on 11/7/12 on the T&C public blog. http://timeandcycles.blogspot.com/2012/11/cycles-forecast-139-td-cycle-has-us.html

Interestingly, the Cycle remains active in determining the next Change in Trend (CIT).

The 1/2 year/6 Lunar Month (LM) Cycle inverted again to a 11/28 Low and 12/3 High,
Green Lines on the chart are direct, Cyan Lines are inverted, but CIT hits nevertheless.

6 Lunar Months = 177 CD = 180 degrees/Opposition = 125 TD Cycle

What is unique here is that the cycle predicts major CITs (Highs or Lows) as it switches between inverted (opposite) and direct Hits.


The 6LM/125 TD Cycle:
1. 03/06/12L = 09/04/12 L Direct
2. 03/19/12H = 09/14/12H Direct
3. 04/02/12H = 09/26/12L Inverted
4. 04/10/12L = 10/05/12H Inverted
5. 04/17/12H = 10/12/12L Inverted
6. 04/23/12L = 10/18/12H Inverted
7. 05/01/12H = 10/26/12L Inverted
8. 05/18/12L = 11/16/12L Direct
9. 05/29/12H = 11/28/12L Inverted
10. 6/04/12L = 12/03/12H Inverted
11. 6/10/12H = 12/10/12 H/L CIT
12. 6/19/12H = 12/18/12 H/L CIT

Since the 10/26 Low, the 6 LM cycle saw a 11/16 major Low, then it inverted again and saw 11/28L and 12/3H. Next CIT to watch is 12/10 H/L, 12/18 H/L, +/-1 TD.


Friday, November 23, 2012

Review & Forecast: 11/16 major Low, up into December

From the 11/16 Daily Email: "The 6 LM Cycle suggests 11/16L and up into 11/27H. Several cycles, including the 6 LM Cycle,  66 week and 132 week and e-waves suggests 11/15-16 Solar & geometric CIT major Low.  Markets declined into the 11/15 Solar CIT, but needs to see a clear reversal higher & close above its steep hourly & daily down channel at 1365 SPX to confirm an initial Low here. We are very oversold here & the E-waves are either complete or should complete  by tomorrow 11/16. We should then see a strong rally into December" 


The NDX 66 week Cycle was the 11/16/12 Low.
3/24/00H-5/22/01H- 10/10/02L-1/22/04H-4/20/05L-7/18/06L-4/26/10H-8/9/11L-
11/16/12 Low
.


The 132 week Cycle was the 11/16/12 Low
3/24/00H - 10/10/02L - 4/20/05L - 10/31/07H - 4/26/10H - 11/16/12 major Low


Actual: We made a 11/16 major Low at the 11/15 Solar CIT and have  rallied a strong 60+ SP's into 11/23, above key NDX down channel resistance, confirming the 11/16 Lows.


The Solar CITs (Change in Trend) have been amazingly useful:

Solar CITs (84-90% accuracy)
10/2 = 10/2 Low
10/9 =  incorrect
10/16 = 10/15 Globex Low
10/23 = 10/22 High
10/31 = 10/30L
11/07 = 11/6 High
11/15 = 11/16 Low

What's next: We should generally see a strong rally into December 2012.

Shorter term, after the current rally, we should decline again and then make another rally into December.

I have a long term geometric CIT due in December.

Long term (LT) geometric Time CITs
9/13 LT CIT was the 9/14 major High
9/27-28 double LT CIT was the 9/26 Low
Next one is a double LT CIT due in December 2012

Sunday, November 18, 2012

This could save someone's life

It will take only 3 minutes to read the information below, but it could save someone's life.

"Research has proven that Genetically Modified (GM)  Food can kill you & cause Cancer and in addition cause Sterility, miscarriages, allergies and damages Liver and Kidneys"

Everyone has heard by now that Genetically Modified (GM)  Food is dangerous to your Health.
Many people "know" about GM food, but they have not really "experienced" the bad and sickening effects of it, which has been proven scientifically, "It doesn't seem to hurt me, so why bother with it", they say, so they take all this GM information for granted, until of course they get cancer, etc. only then they will really know, by that time it is too late as the damage has already been done.

Knowing that GM food is bad for you and still eating it, is similar to
Knowing smoking is bad for you and still smoking, and is similar to
knowing Alcohol is bad for you and still drinking.

Similar to alcohol and cigarettes, research has proven that Genetically Modified (GM)  Food can kill you & cause Cancer and in addition cause sterility, miscarriages, allergies and damages Liver and Kidneys.

Knowing something is one thing, but applying this knowledge into real life is a whole other story.
Knowledge not applied to real life is not real knowledge.

Here are the numerous reasons to avoid GMO Foods:


Can't get pregnant? This may be the problem: Genetically Modified Soy Linked to Sterility, Infant Mortality  http://www.responsibletechnology.org/article-gmo-soy-linked-to-sterility

http://www.responsibletechnology.org/
FDA scientists
had repeatedly warned that GM foods can create unpredictable, hard-to-detect side effects, including allergies, toxins, new diseases, and nutritional problems. They urged long-term safety studies, but were ignored.
gmo danger2


Since then, findings include:

  • Thousands of sheep, buffalo, and goats in India died after grazing on Bt cotton plants
  • Mice eating GM corn for the long term had fewer, and smaller, babies
  • More than half the babies of mother rats fed GM soy died within three weeks, and were smaller
  • Testicle cells of mice and rats on a GM soy change significantly
  • By the third generation, most GM soy-fed hamsters lost the ability to have babies
  • Rodents fed GM corn and soy showed immune system responses and signs of toxicity
  • Cooked GM soy contains as much as 7-times the amount of a known soy allergen
  • Soy allergies skyrocketed by 50% in the UK, soon after GM soy was introduced
  • The stomach lining of rats fed GM potatoes showed excessive cell growth, a condition that may lead to cancer.
  • Studies showed organ lesions, altered liver and pancreas cells, changed enzyme levels, et
Got Bad Liver and Kidneys? This may be the cause:
http://archive.truthout.org/1215091

GM Food Damages Liver and Kidneys

Excerpts from most recent article above:
"GM crops, including some that are already in our food and animal feed supply, have shown clear signs of toxicity in animal feeding trials – notably disturbances in liver and kidney function and immune responses."

"Roundup, the herbicide that over 50% of all GM crops are engineered to tolerate, is not safe or benign as has been claimed but has been found to cause malformations (birth defects), reproductive problems, DNA damage, and cancer in test animals. Human epidemiological studies have found an association between Roundup exposure and miscarriage, birth defects, neurological development problems, DNA damage, and certain types of cancer."

Jeffrey Smith's GMO update, July 2012 - covers latest research, GMO labeling and more
http://www.youtube.com/watch?v=Bv1_oTfqtRI&feature=related


You CAN avoid GMOs, if you know what to look for.
First of all, remember there are eight genetically modified food crops:

  1. Soy
  2. Corn
  3. Cottonseed (used in vegetable cooking oils)
  4. Canola (canola oil)
  5. Sugar from sugar beets
  6. Hawaiian papaya
  7. Some varieties of zucchini
  8. Crookneck squash
Unfortunately, 70% of food in USA are GMO versus only 5% in Europe.  GM foods are found in 80% of all the food in the USA supermarkets, it is in many cooking Oils, Milk, Bread, Candy, Sodas, meats & processed canned foods.
Most cooking Oils is either GM Corn Oil, GM vegetable Oil (cottonseed)  or GM Canola Oils, best to use Olive Oil or Sunflower Oil
Most milk has the RSBT GM hormone, Best to use RSBT free milk. Hyvee & Walmart sells them.
Most of the Soy sauces are GM Soybeans, best to use Organic Soy sauce.
Most breads contain GM Corn or soybeans ingredients.
Most Candy contains GM Corn Syrup & GM sugar.
All Sodas (Coke, pepsi, etc.) contains GM Corn Syrup & GM sugar
Even the sugar you use is mostly from GM sugar beets, unless the sugar is from sugarcane sugar.
Most animals, including chicken, are fed GM Corn. Organic Corn is more expensive, so it is highly likely that the farmers will simply use GM Corn in their feed.
North America does not have GMO potatoes, but over 90% of the soybean and over 60 % of the corn grown in the US is genetically modified.
http://www.potatopro.com/newsletters/20100310.htm


Below is a GM shopping guide:
http://mercola.fileburst.com/PDF/GMObrochure.pdf

The 12 foods listed below are not all GMO, but is still full of pesticides and should be eaten organic:

http://www.fitnhealthynutrition.com/2011/01/03/top-12-highly-sprayed-foods%E2%80%94buy-organic/

Dirty Dozen: 12 worst conventional picks (contain the most pesticide residue):
  • Peaches
  • Apples
  • Sweet bell peppers
  • Celery
  • Nectarines
  • Strawberries
  • Cherries
  • Kale
  • Lettuce
  • Grapes
  • Carrots
  • Pears
Clean 15: 15 best picks (contain the least pesticide residue):
  • Onion
  • Avocado
  • Sweet corn
  • Pineapple
  • Mango
  • Asparagus
  • Sweet peas
  • Kiwi
  • Cabbage
  • Eggplant
  • Papaya
  • Watermelon
  • Broccoli
  • Tomato
  • Sweet potato

Wednesday, November 7, 2012

Cycles forecast: The 139 TD Cycle has us down into 11/9L +/-1

From this past 11/3 weekend Email: "  The next 10 TD Hurst Cycle is due on 11/9 Low+/-2. There is a regular 139 TD Cycle due on 11/9 Low as well. Various Cycles, including the 45 Yr Cycles suggest we should see a drop into 11/7-8L+/-. There are very high odds Monday 11/5 closes up for the day"

From 11/5 daily Email:  "Cycle Summary: 11/5-6H, down to 11/8L.
Time CIT:  There is a 11/6 MeR, 11/7 Solar and 11/08 geometric CIT supporting a 11/7-8 Low. 
11/8-9 Fibonacci cluster: 9/14H+55CD =11/8, 8/21H +55TD=11/9, 7/3H+89 TD =11/9, 2/5/10L+144wks=11/9"

Actual: We saw a 11/6 High at the Mercury Retrograde and are seeing a sharp decline today 11/7.


The 139 TD cycle has been very reliable in the past and is also pointing down into 11/9 Low +/-1. 

A closer look at the 139 TD Cycle confirm that the Lows are at most +/-1 TD (not +/-3).

2/5/10L + 140 = 8/27/10L +139 = 3/16/11L + 140 = 10/4/11L + 138 = 4/23/12L + 139 = 11/9L+/- 1 TD

Thursday, October 25, 2012

The 37 TD Cycle, Fibo Spirals and the 6 LM Cycle have an 10/26 Low +/-1

On 10/15 http://timeandcycles.blogspot.com/2012/10/mars-rahu-aspect-and-november-elections.html
I mentioned: "The NDX has a regular 37 TD Cycle due around 10/25 time frame, most likely a Low."


Actual: The NDX declined into its 37 TD Low into 10/26 Lows.


From Tuesday 10/23 daily Email: "Various cycles suggest  10/23H, which is the MD High, decline into 10/26 Low of the week


Actual: We made a brief 10/22 High of the week and a declined into 10/26 Low of the week


The Fibonacci Spiral from 10/26/12 +/-:
-  89 TD = 06/19/12H (+2)
-144 TD = 04/02/12H (+1)
-233 TD = 11/25/11L (-1)
-377 TD = 05/02/11H
-610 TD = 05/25/10L (+2)
-987 TD = 11/21/08L (+2)

The Fibonacci Spiral from 05/02/11H: 
+ 13 TD = 05/19/11H
+ 21 TD = 06/01/11H
+ 34 TD = 06/16/11L (-2)
+ 55 TD = 07/21/11H (+1)
+ 89 TD = 09/06/11L (-1)
+144TD = 11/21/08L (+1)
+233TD = 04/02/12H (-1)
+377TD = 10/26/12L +/-1
   

The 1/2 year / 6 Lunar Month (LM) inverted Cycle has Friday 10/26 +/-1 as a swing Low.   

6 Lunar Months = 177 CD = 180 degrees/Opposition = 125 TD Cycle
What is interesting here is that the cycle is inverted = opposite or 180 degrees.


The 6 LM/125 TD Cycle ( Click on chart to enlarge):
1. 03/06/12L = 09/04/12L
2. 03/19/12H = 09/14/12H
3. 04/02/12H = 09/26/12L => Inverted
4. 04/10/12L = 10/05/12H
=> Inverted

5. 04/17/12H = 10/12/12L => Inverted
6. 04/23/12L = 10/18/12H => Inverted
7. 05/01/12H = 10/26/12L => Inverted

The 37 TD, Fibonacci Spiral and the 6 Lunar month inverted cycle have an 10/26 Low+/-1

Friday, October 19, 2012

10/19 Quick Update

From my last post: http://timeandcycles.blogspot.com/2012/10/1017-high-and-wedge-target-acheived.html. We were looking for an 10/12 triple CIT Low, a sharp rally into 10/17 High and from there, "we should make a decline into the next geometric CIT due on 10/19. There is an hourly CIT due in the last hour of Friday 10/19"


Actual: We are seeing the expected decline into 10/19 geometric CIT. 

What's next: If we decline into the last hour today, we could see a spillover decline into Monday 10/22.

Thursday, October 18, 2012

10/17 High and Wedge Target achieved

From this last weekend 10/12 report: "We have declined into the 10/12-15 quadruple Time Cluster CIT suggesting a Low is forming. We can see a spillover decline into Monday 10/15 CIT. We should then see a rally into OE week." 

Actual: We saw an 10/12 major Low and an 10/15 Globex Low, before a sharp rally.


Monday 10/15 intraday Update: "So far so good. We rallied above the bullish descending wedge DTL and 1433 SPX confirming the 10/12 triple CIT was the Low.We should now rally into 10/16-17 Solar CIT High.  The current bias basis CITs: rally into 10/17H at 1st hour CIT, decline into 10/19L at last hour CIT"

Tuesday 10/16: "There is a descending triangle target around 1457-59 SPX, right at the 70.7% retrace."


Actual: We rallied right into 10/17 High, achieving the projected 1459 SPX Wedge Target and closed right below the 78.6% retrace at 1460.91 SPX. The intraday High was achieved right at the Apex (yellow) of the descending wedge, suggesting atleast a short term 10/17 High.

What's next?: We should make a decline into the next geometric CIT due on 10/19. There is an hourly CIT due in the last hour of Friday 10/19. The intraday Cycle today 10/18 is a "Low am to High pm" day, which suggests a 1st hour Low and a last hour High (see chart above).

Monday, October 15, 2012

Mars Rahu aspect and the November Elections cycles


I mentioned Mars was conjunct Rahu (Moon's North Node) on 10/2 back in August 2012,
http://timeandcycles.blogspot.com/2012/08/mars-and-vedic-dragon-aspect-next-due.html
which became the 10/5 major High.

I had a quadruple geometric 10/12-15 CIT (triple on 10/12, 1 on 10/15) that became the 10/12 Low.


The NDX has a regular 37 TD Cycle due around 10/25 time frame, most likely a Low.

There is a cluster of cycles all due in November 2012,  first mentioned about 9-10 months ago in the 2012 T&C forecast. This suggests some fireworks are due in the November Election month.

Monday, October 1, 2012

Dominant Cycle Update

The dominant Cycle has been active, since the 4/2/12 High and has seen many high Quality solid hits, with no Inversions (which is ideal). I first mentioned the dominant cycle in the markets on my 9/13th blog post: http://timeandcycles.blogspot.com/2012/09/cycle-update-910-high-911-low-up-into.html

Since then the dominant Cycle predicted the following Highs and Lows (Cyan Lines), all within 1 TD:
 9/10H, 9/11L, 9/17H (9/14H,-1TD), 9/19L (9/20L), 9/24H (9/21H,-1 TD).


From last weekend's 9/22 Email: "The dominant cycle suggests: 9/24H (9/21H), decline into 9/26L, then a solid rally into 10/2H, all +/-1."

Actual: We saw a 9/21 High, 1 TD earlier, and a decline into 9/26 Cycle Low, which was a Bulls-eye hit. Time CITs: The 9/25 Solar CIT and the 9/26 Apex CIT supported this 9/26 Cycle Low and reversal higher. So far So good.

What's next?:  From the 9/26 Cycle Low, we should continue to rally into 10/2 Cycle High+/-1.
Time CITs (Change in Trend): This 10/2 cycle High is support by a double 9/28-29 weekend geometric CIT, but more important by an 10/2 Solar CIT, which has an 84-90% accuracy.

This Cycle has been active since the 4/2 major High, but has only been recently discovered. It is an exact repetition of a certain historic pattern of Highs and Lows. As long as this cycle remains active, we can ride the waves as it will continue to be precise. Let's see how long it continues.

Friday, September 21, 2012

Cycle Update: 9/17H, 9/19L, Up into 9/24H

From last weekend's 9/15 email: "The active cycle suggests  a rally into 9/17H, decline into 9/19 Low, rally into 9/24 High, all +/- 1 TD"


Actual: 9/14 High (-1), 9/20 Low (+1), next is Up into 9/24 cycle High.
The 9/17 Cycle High, arrived 1 TD earlier at the 9/14 High and the 9/19 Low arrived 1 hour later, in the 1st hour of 9/20 Low at 1449.98 SPX. We then reversed higher and rallied the rest of the day, closing at 1460.26 SPX yesterday. The rally phase should continue today.

What's next: We should continue to rally into 9/24 cycle High, before the next pullback.
Overall we should be higher into end of the year, with some sharp pullbacks along the way.
October should be full of surprises for many, but 2012 should end on an Up note.

Thursday, September 13, 2012

Cycle Update: 9/10 High, 9/11 Low, up into 9/17 High

From the Daily Email 9/12 update:
"The recent active Cycle found, has been in the markets for over 5 months now, since the 4/2/12 High has seen many high Quality solid hits, with no Inversions (which is ideal) and all Pivots, all predicted Highs and Lows are often exact or +/- 1 TD and suggests the 9/11 Solar CIT was a LOW and we should rally into 9/17-18 Solar CIT.  I have not found a cycle this precise in many months. It suggests tomorrow 9/13 (Fed Day) will be a strong Up day and is Up into 9/17H"


This Cycle predicts: 9/10H,  9/11L, next is up into 9/17 High.

Actual: 9/10 High, 9/11 Low, Strong Up on FED Day as predicted and higher ever since the 9/11 Low.

I have not found a cycle this precise and active in many months.

Normal cycles versus Master Cycles 

With any of the Master Cycle and other cycles that are considered "active", all predicted Highs and Lows are +/- 1 TD.

The main rule that I use is the Cycle is not considered active, ie it will be incorrect,  if it exceeds this 1 TD variance of predicted Highs and Lows.

The benefit is you will know right away if the cycle is incorrect within 1-2 Trading days. If the Cycle is not active it should not be used for future predictions of Highs and Lows.

Other "normal" cycles, does not have this kind of accuracy, as all of them are +/- a couple of weeks.


Thursday, September 6, 2012

Review and the 2012 T&C annual forecast

From last weekend's Email 9/1 forecast:  "The dominant Master Cycle suggests 9/1 High, 9/5 Lows of the week, then higher into Friday 9/7H"

Actual: The markets made an 8/31 High, dropped into 9/4 Low of the week and is now retesting  the 8/21 Highs today, 9/6.


The break above the mini sideways channel projects to a 1434 SPX target, which has been my long term target, where wave A = C = 1434.44 SPX (click on weekly chart to enlarge)


Wave A=7/1/10L-5/2/11H =359.67 SPX (360 degrees in price)

Wave C = 10/4/11L at 1074.77 + 359.67 = 1434.44 SPX

This  is likely by the 9/7 Master Cycle High.

So what is next?

The question is will the markets stop there?

The answer is Yes, but only for some time, before we make higher Highs.

In  my 2012 annual forecast, I had a rare 3 long term geometric SPX CITs (Change in Trend), covering Decades, all clustering on one date, Friday 6/1/12, which became the Monday 6/4/12 Low right at the Open. http://timeandcycles.blogspot.com/2012/06/long-term-timing-points.html

This 6/4/12 Low became the 187 week Cycle Low that was posted on my blog back in June 2012.  http://timeandcycles.blogspot.com/2012/06/long-term-crash-panic-cycle-critical.html

There is a Time and Cycle cluster mentioned in the annual forecast due right around the important November Elections that should be important to watch.

In my 2012 annual forecast, since the beginning of the year, for many reasons, had 2012 as an up year, which has been the case so far.


Thursday, August 23, 2012

August Major High?

From last weekend's Email: "The forecast is an 8/17-20 Solar CIT High, down into 8/22- geometric and 8/23 Solar CIT Low of the week"

Actual: We made a 8/21 High(+1 TD) and declined into 8/23 Solar CIT Low of the week.

What's next: 8/23 Solar CIT is most likely an 8/23-24 Low, which is the 10 TD Hurst Low.

We should rally into the next Solar CIT High.

The VIX weekly on 8/20 touched major long term triple horizontal channel support.

The last 3 VIX Trendline Lows were near major stock Market Highs:


1. April 2010 Major High,  

2. April - May 2011 Major High

3. March-April 2012 Major Highs

4. August 2012 Major Highs?


Sunday, August 19, 2012

Mars and the Vedic Dragon aspect next due on 10/2/12

Review:

The August 1st week Square and static Cycle mentioned here:
http://timeandcycles.blogspot.com/2012/08/the-august-square-static-cycle-cluster.html
was a 7/24 major Low and 8/2 higher Low.

The important 93 week Bond market cycle was the 7/25 Interest Rate Low and Bond High:
http://timeandcycles.blogspot.com/2012/08/did-we-see-major-interest-rate-bottom.html
The markets has since touched make or Break resistance and closed right on it last week.


I have written about the Mars and the Vedic Dragon (Rahu=the Moon’s North Node) aspects in the past (Email me for the pdf report at timeandcycles@gmail.com). 

More recently the Mars Rahu (Moon’s North Node) hard aspects (Red lines) has been turning the markets and the next one is due on 10/2/12.


Mars 180 True Node 07/23/2011 17:34 was the 7/21/11 major High
Mars 090 True Node 12/13/2011 06:12
was the 12/19/11 major Low
Mars 090 True Node 03/19/2012 18:30 was the
4/2/12 major High
Mars 090 True Node 04/30/2012 23:30
was the 5/1/2012 secondary High
Mars 000 True Node
10/02/2012 15:06
Mars 090 True Node 01/24/2013 19:48
Mars 180 True Node 05/13/2013 05:46


Wednesday, August 8, 2012

The August Square & Static Cycle cluster

There are an unusual 10 cluster of Squares centered around August 6th +/-

10 Squares due in the 1st week of August
1. Squares from 7/8/32L + 171^2 =7/29/12
2. Squares from 4/2/12H + 11^2 = 8/1/12
2. Squares from 8/27/10L + 22^2 = 8/2/12
3. Squares form 3/17/08L + 40^2 = 8/3/12
4. Squares from 7/18/06L+ 47^2 = 8/4/12
5. Squares from 11/13/12SE – 10^2 = 8/5/12
6. Squares from 7/1/10L + 23^2 TD = 8/6/12
7. Squares from 4/26/2010H + 24^2 TD = 8/7/12
8. Squares from 10/11/07H +42^2 = 8/9/12
9. Squares from 4/26/10H +29^2 = 8/14/12

Every one of these squares have produced major Highs and Lows in the past.

A few examples from the list above:

# 4 (above): Squares from 7/18/06 Major Low
43^2 = 8/10/11 => 08/09/11 major Low
44^2= 11/5/11 => 10/27/11 High
45^2= 2/2/12 => 1/30/12 Low
46^2 = 5/3/12 => 05/01/12 major High
47^2 = 08/04/12

#6 (above): Squares from 7/1/10L
441 TD 3/30/12 => 4/2/12 major High
484 TD 6/1/12 => 6/04/12 major Low
529 TD è 8/6/12


There are also an unusual 10 static/fixed cycles (click on charts to enlarge) all due around 8/6-10 week
 
The 53 TD Cycle of Lows:  5/2/11H, 7/18/11L, 10/4/11L, 12/19/11L, 3/6/12L, 5/18/12L, 8/6/12

The 32/64 TD cycle: 3/16/11L, 5/2/11H, 6/16/11L, 8/1/11H, 9/16/11H, 11/11/11L, 12/19/11L…6/21/12L, 8/6/12

The regular 106 TD Cycle: 7/1/10L-11/29/10L-5/2/11H-10/4/11L-3/6/12L-8/6/12


The 89 TD Cycle is next due on 8/8
7/1/10L, 11/5/10H, 3/16/11L, 7/21/11H, 11/25/11L, 4/2/12H, 8/8/12

 The 177 TD Cycle: 10/21/09H, 7/1/10L, 3/16/11L, 11/25/11L, 8/8/12

 The 216 TD Cycle: 3/6/09L, 1/14/10H, 11/29/10L, 10/4/11L, 8/8/12

The 36 week Cycle of Lows is due in the 8/3/12 week +/-1 wk: 11/2/09L – 7/1/10L – 3/16/11L -11/25/11L – 8/3/12 week.

 The next 66 week Cycle = 5/2/11H -33 wks-12/19/11L-33 wks-  8/8/12 wk

11 week Cycle: 11/29/10L-2/18/11H-5/2/11H-7/22/11H-10/4/11L-12/19/12L-3/6/12L-
5/22/1L2-8/7/12 wk

22 week/150-55 CD Cycle: 9/2/09L--2/5/10L-7/1/10L--11/29/10L--5/2/11HH--10/4/11L-3/6/12L-8/7/12 wk

55 week/385 CD Cycle: 5/19/08H -388- 6/11/09H-385-7/1/10L-385-7/21/11H-385-8/9/12 wk

Tuesday, August 7, 2012

Did we see a major Interest Rate Bottom and Bond market High?


The weekly Bond markets Interest Rates saw a regular 93 week cycle major Low (and Bond High) at the 7/25 Low at 24.52, piercing below the double bottom at 25.10-25.19. 

The weekly Bonds are in a descending triangle and needs to close above it at 29.70 to be bullish.   A solid breakout above the descending triangle would confirm a major Interest Rate Bottom and Bond market High is in place, until then, we can still fall back to lower Interest rates.

Saturday, July 28, 2012

Cycle Update: 7/19 High, 7/25 Low

From the previous post: http://timeandcycles.blogspot.com/2012/07/cycle-update-712l-719-20h.html: "The next couple of weeks should be interesting to watch and will determine the direction of the next couple of months afterwards."

From last weekend's 7/20 Email: "The 3 active cycles,  so far agreed on the 7/3H, 7/12L and 7/19H and all agree we see at least a 7/25 Low, where the 10 TD Hurst cycle Low is due, but then these cycles diverge."

From the 7/25 daily Email: "The 7/23 Solar CIT and 7/25 geometric CIT could have been a 7/24 Low... The speculative path indicates July 25 Low and up into XXX"

Result: The markets saw a 7/24 Low of the week, fulfilling the 7/23 Solar and 7/25 geometric CIT. Globex was lower on 7/25 and reversed strongly the rest of the week.  

The rally was stronger than expected, but remains within a large 60 SP sideways channel since the 6/19 High (see SPX Daily above), for the last 5 weeks now, with major channel resistance at 1392-1396 SPX  in  the coming week.  

In the mean time, 2 cycles remains dominant with the 7/24-25 Low. The coming week will be most interesting to watch closely as very large moves are forecasted by these 2 dominant cycles.

Thursday, July 19, 2012

Cycle Update: 7/12L, 7/19-20H

From the last post http://timeandcycles.blogspot.com/2012/07/cycles-update-72-3-high-down-to-711-12.html: "So Far, so good, we topped out on 7/3 cycle High and are now down into 7/11-12 Time CIT and Master Cycles Low. We should see a rally into Option Expiration week."
The Banks had a triple  7/11 CIT, which was the 7/12 Low and has rallied ever since. The Banks has an 8/23 CIT.


 We made a 7/12 SPX Low and have rallied strongly into OE week as expected.


So what is next?
The next couple of weeks should be interesting to watch and will determine the direction of the next couple of months afterwards.

Tuesday, July 10, 2012

Cycles Update: 7/2-3 High, down to 7/11-12 Low

From 2 weeks ago and in the 7/2 weekend Email: 
"This rally should complete ideally into the 7/2-3 Solar, geometric and Time and Price Square"
"Various Master Cycles General Bias: 7/2-3H, down to 7/11 Low"

On the last public blogpost on 7/3:
 'There are some Master Cycles (MC) that are active right now. To supplement the Master Cycles, We look at the various markets that has important Time CIT turning points:
The next major Time CIT to watch is on: 7/11-12, that is a triple CIT in the Banks (see chart above), a Solar and a geometric CIT."
 
and more recent via email: "Shorter term the 10 TD Hurst Cycle has topped out and we are now down into 7/11 Lows +/-2. The Banks has a triple 7/11 CIT and there is a 7/11 Solar and geometric CIT there as well, ideally a Low"


So Far, so good, we topped out on 7/3 cycle High and are now down into 7/11-12 Time CIT and Master Cycles Low. We should see a rally into Option Expiration week.

Tuesday, July 3, 2012

Cycles, the Banks and the US Dollar Time CITs

All Cycles in general expand and contract, the only exception is when the Master Cycles are active, they predict precise Highs and Lows. All cycles in general though are not that precise, like the 187 week Cycle that has either contracted or expanded as it was looking for a 6/25 week major Low (see previous posts).

There are some Master Cycles (MC) that are active right now. To supplement the Master Cycles, We look at the various markets that has important Time CIT turning points:


The next major Time CIT to watch is on: 7/11-12, that is a triple CIT in the Banks (see chart above), a Solar and a geometric CIT. The Banks has resistance at 47.20 and also has a 8/23-24 Time and Cycle CIT.


The Dollar Chart had a fixed 75 TD Cycle that was due on 6/29.
The Dollar Time CITs are on 7/23 and 8/3

Friday, June 29, 2012

Review of the 187 week Panic cycle and what's next

From the previous post: "Of course, all cycles do expand and contract, but it is interesting that there is an unusual 6/22-26 Time & Cycle Cluster in the coming Panic Cycle week."

The  recent 6/22-26 Time Cluster was the 6/25 Low of the week, which was a solid hit. The previous Time Cluster was the triple Long term CIT due on Friday 6/1, which was the Monday 6/4 Major Low.   Both Time clusters were direct hits and important Lows.


The regular 187 week Panic Cycle due this past week has either contracted to 184.5 weeks to the 6/4 Major Low or will expand into the near by future date as we saw on the 5/22/01 High, which was one of the 186 week Cycle dates. This makes the July Month an interesting month to watch.

There are some upcoming Time & Cycle Clusters in the month of July that should be important Highs and Lows to monitor. The current active Master Cycles focuses on 3 important July Dates in the nearby future. The Banks has an upcoming triple Time & Cycle CIT cluster that should mark an important turning point. It should cause some large price movements.