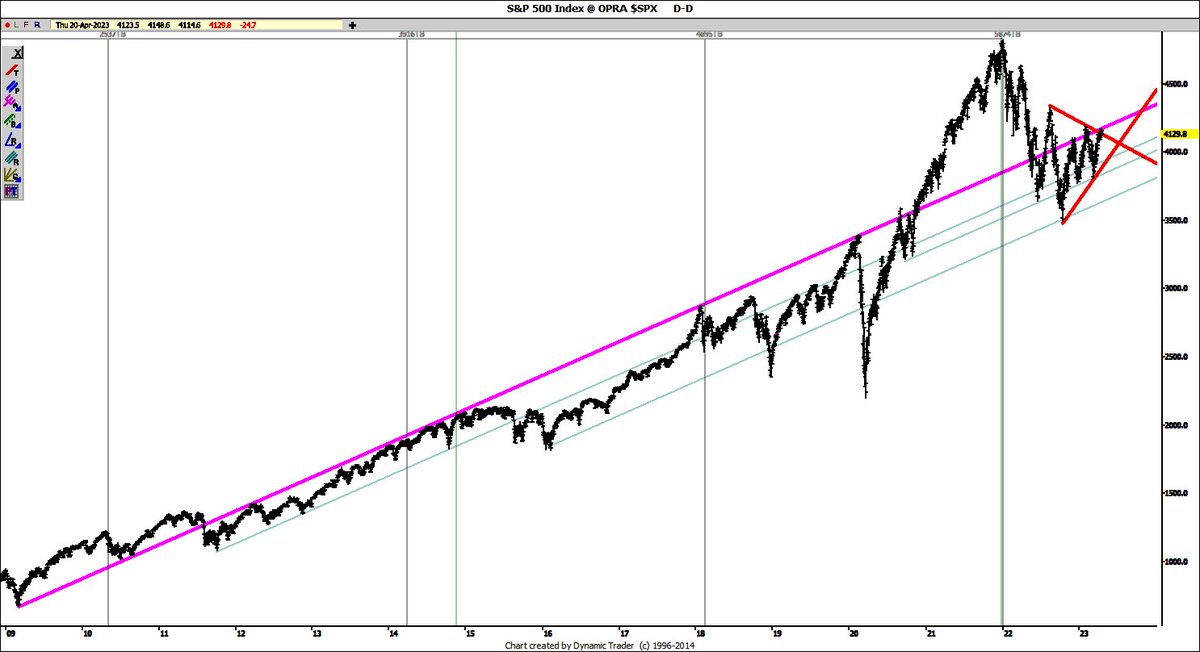
Right at Long term Trend lines resistances...R U Ready?
Thursday, April 20, 2023
Monday, April 17, 2023
The Flash Crash Cycle starts from April 2023 High

The May 6 2010 mini Crash became known as the Flash Crash. I first discovered a 360 Trading Day (TD, Gann’s 360 degrees) cycle and posted it on my public blog, when the Flash Crash occurred, which is why I named it the Flash Crash (FC) cycle.
The 360 TD Cycle is about 75 weeks, which has been in the markets ever since the April 14 2000 mini Crash Low and has since pinpointed 9 major crash Lows in the past 23 years, including the 4/14/00 mini crash Low, 9/21/01 crash Low, 3/12/03L, 8/13/04L, 11/21/08 crash Low, 5/6/10 Flash Crash, 10/04/11 Low, 2/5/16 crash Low, 12/26/18 Crash Low and more recently 11/05/21 All time High in many indices and market leaders, like Russel, Bitcoin, Ethereum and Tesla.
Many of the 360 TD/75 week flash crash cycle Lows were major Panic Lows, like the 4/14/00 Low, 9/21/01 Panic Low, 11/21/08 Banking crisis Low, 10/4/11 major Low, 2/5/16 crash Low and 12/26/18 crash Low. A few, like the 3/12/03 Low and 8/13/04 Low were not Panic Lows, but still major Lows. Some were important Highs, like the 11/5/21 major High in many indices. At times the FC Cycle skips a beat, out of the last 16, 10 (63%) were direct hits and 6 (37%) were misses.
The Flash Crash 360 TD / 75 week Cycle:

04/14/00L – 09/21/01L = 01 X 358.00 TD = 01 X 525 CD = 01 X 75.00 weeks
04/14/00L – 03/12/03L = 02 X 363.50 TD = 02 X 531 CD = 02 X 75.86 weeks
04/14/00L – 08/13/04L = 03 X 362.00 TD = 03 X 527 CD = 03 X 73.33 weeks
04/14/00L – 11/21/08L = 06 X 360.67 TD = 06 X 524 CD = 06 X 74.83 weeks
04/14/00L – 05/06/10L = 07 X 361.14 TD = 07 X 525 CD = 07 X 74.98 weeks
04/14/00L – 10/04/11L = 08 X 360.63 TD = 08 X 524 CD = 08 X 74.82 weeks
04/14/00L – 01/20/16L = 11 X 361.82 TD = 11 X 525 CD = 11 X 75.00 weeks
04/14/00L – 12/26/18L = 13 X 361.76 TD = 13 X 525 CD = 13 X 75.00 weeks
04/14/00L – 11/05/21H = 15 X 361.60 TD = 15 X 525 CD = 15 X 75.00 weeks
The Flash Crash Lows were preceded by an average 18% decline:
- 04/14/00 Crash Low saw a 213.57 SP decline, a 14% decline.
- 09/21/01 Crash Low saw a 371.18 SP decline, a 28% decline.
- 03/12/13 major Low saw a 165.38 SP decline, a 17% decline
- 08/13/04 major Low saw a 102.51 SP decline, a 9% decline.
- 11/21/08 Crash Low saw a 699.36 SP decline, a 49% decline
- 05/06/10 Flash Crash saw a 139.34 SP decline, a 12% decline
- 10/04/11 Crash Low saw a 295.81 SP decline, a 22% decline.
- 01/20/16 Crash Low saw a 322.43 SP decline, a 15% decline.
- 12/26/18 Crash Low saw a 594.30 SP decline, a 20% delcine
The exact 360 Trading Day cycle, when they worked,deviated 2-8 TD, but the last 2 deviated by 23-24 TD (+/-4.5 weeks)
04/14/00L +360 TD X 1 = 09/21/01 Crash Low, + 2 TD
04/14/00L +360 TD X 2 = 03/12/03 Major Low, – 7 TD
04/14/00L +360 TD X 3 = 08/13/04 Major Low, – 6 TD
04/14/00L +360 TD X 6 = 11/21/08 Crash Low, – 4 TD
04/14/00L +360 TD X 7 = 05/06/10 Flash Crash, – 8 TD
04/14/00L +360 TD X 8 = 10/04/11 Crash Low, – 5 TD
04/14/00L +360 TD X 11 = 01/20/16 Crash Low, – 4 TD
04/14/00L +360 TD X 13 = 12/26/18 Crash Low, – 23 TD
04/14/00L +360 TD X 15 = 11/05/21 All time High, – 24 TD
Swing High before the Flash Crash Low
03/24/00H – 04/14/00L = 021 CD / 0.7 Months
05/22/01H – 09/21/01L = 122 CD / 4.0 months
12/02/02H – 03/12/03L = 100 CD / 3.3 months
06/24/04H – 08/13/04L = 050 CD / 1.7 Months
08/11/08H – 11/21/08L = 102 CD / 3.4 Months
04/26/10H – 07/01/10L = 066 CD / 2.2 Months
07/07/11H – 10/04/11L = 089 CD / 2.9 Months
11/03/15H – 01/20/16L = 078 CD / 2.6 Months
09/21/18H – 12/26/18L = 065 CD / 2.2 Months
The declines from the swing High to the Flash crash Lows have averaged 78.5 CD or 2.6 Months +/-. The majority has varied from 2.2–3.4 months. This means we should top out an average of 2 ½ months before the Flash Crash Lows.
The Biblical 7 year Cycle and the 360 TD Flash crash Cycle
http://timeandcycles.blogspot.com/2014/12/the-biblical-7-year-cycle-and-360-td.html
Forecasted on 12/17/14 (see link above):
“The future 9/28/15 Blood Moon total Lunar Eclipse is another biblical 7 years/1800 TD (Trading Days) from the 8/11/08 swing High, before the panic into 11/21/08 crash Low, which was 1805 TD from the 9/21/01 Crash Low and 1800 TD in the future is January 2016.”
5 X 360 TD Flash Crash cycle is the 1800 TD cycle, which is the well known 7 year Biblical cycle, which suggested a sharp decline in January 2016, being 7 years/1800 TD, from the 11/21/08 Crash Lows, which was 7 years/1805 TD from the 9/21/01 Crash Lows. The 1800 TD Cycle varies between 1790 and 1805 TD.
This 1800 TD/7 year cycle+/- has pinpointed major Highs and Lows in the past:
1. 10/11/07H – 12/05/14H =1800 TD
2. 08/13/04L – 10/04/11L = 1798 TD
3. 03/12/03L – 04/26/10H = 1793 TD
4. 03/12/03L – 05/06/10L = 1801 TD (Flash Crash)
5. 09/21/01L – 11/21/08L = 1805 TD
6. 09/01/00H – 10/11/07H = 1785 TD
7. 08/11/08H – 09/28/15H = 1792 TD
8. 11/21/08L – 01/20/16L = 1800 TD
9. 01/20/16L - 03/13/23L = 1798 TD or
10. 02/11/16L - 04/14/23H = 1805 TD?
Conclusion: The Flash Crash Cycle of Lows pinpointed 9 major crash Lows, in the past 23 years, with an 18% average decline and the majority have deviated maximum 8 TD (2 were 24 TD from its exact 360 TD cycle. It has a 63% chance of seeing a decline into it. The 1800 TD/ 7 Year Cycle is 5 X 360 TD cycle has also pinpointed major Highs and Lows in the past, including the recent 1/20/16 Low. If we are going to see a Flash Crash cycle we should see a major swing High in April 14 2023+/- 1 Month, before we see a sharp 18% decline into the next major Lows. You won’t want to miss the upcoming decline. Be forewarned and be prepared.
To join our free forecasts, subscribe, retweet, like & follow us at: Email: timeandcycles@gmail.com
Disclaimer: Trading in Stocks, ETF, Options and Futures involve risks. Trade at your own Risk. Do your own homework. The contents of this blog are for general information and educational purposes only and should not be construed as an investment advice strategy. Past performance is no guarantee of future results.
Monday, April 3, 2023
4/4 High, Bitcoin & SPX at LT Channel resistance

Bitcoin saw a strong 49% rally since the Banking Crisis began, with 3/10/23 SVB Collapse, but it has been sideways since 3/20/23, because it is right at long term make or break weekly channel resistance. Bullish above, Bearish below.

We are also approaching major Long term Make or Break SPX Resistance area. Bullish above, Bearish below.

Today, 4/4 was an Apex CIT, among other Time and Cycle clusters and has the potential to be a major turning point.

The Symmetry Point Cycle suggest another reason for the 4/4/23 High.
Subscribe to:
Posts (Atom)