Thursday, April 28, 2016

A potential mini crash wave is on the Horizon

http://safehaven.com/article/41267/a-potential-mini-crash-wave-is-on-the-horizon

In my last public blog post a few days ago, I was looking for an 4/26 Geometric CIT Low, that was either the 4/25 Low or it could be inverting to an important 4/27 swing High instead.

To get the Timing right, I use my proprietary Timing Change in Trend (CIT = High or Low) dates that are either exact or  +/- 1 day, below are the most recent ones (as mentioned at http://timeandcycles.blogspot.com/ in the past)


Time CITs:

  1. 4/13 Time Square CIT => 4/12L
  2. 4/20 Geometric and Solar CIT => 4/20H
  3. 4/26 Geometric CIT => 4/25L or 4/27H?


The 4/26 Geometric Time CIT was either the 4/25L@ 2077.52 SPX or 4/27H@ 2099.89 SPX. 
If we decline below that 4/25L, then the 4/27 High gets confirmed as the 4/26 Geometric CIT and if we rally above the 4/27H, then the 4/25L gets confirmed.


Cycle CITs:

I have been following an active Inverted cycle in my newsletter, ever since the 2/11/16 major Low.  An Inverted cycle means it is a historical cycle that is predicting exact future Highs and Lows, within 1-2 days, but inverted, meaning a past High is predicting a future Low and a past Low is predicting a future High.

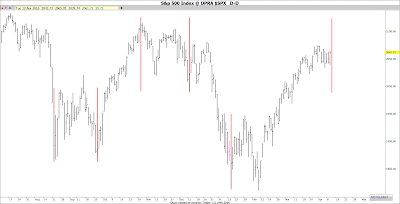
This dominant inverted cycle (red vertical lines on chart) has seen 9 “hits” and 1 miss:

  1. 2/11L
  2. 2/24L
  3.  3/4H
  4. 3/11L(-1)
  5. 3/17H (miss)
  6. 3/28L(-1)
  7. 3/31H(+1)
  8. 4/12L
  9. 4/22H (-2)
  10. 4/26 Low or High?


At any point this inverted cycle can invert back to a “straight” cycle and that may be the case at the inverted cycle’s projected 4/26L may have inverted to an 4/27H. The next few days will make that clear.

Why is that important? Because if we did see an 4/27H, then that same cycle now suggests a mini Crash wave is on the Horizon and that historical Crash Low date was on one of Carolan’s infamous Dark Days.“The lunar dates 7-27 and 7- 28 are the “dark days, ” encompassing the various Black Tuesdays of N.Y. in 1929 and Hong Kong in 1997, and the Black and Blue Mondays in N.Y. in 1987 and 1997 respectively. In each case, lunar date 7-28 marked the end of the panic and the next two days, 7- 29 and 7-30”

What is interesting here, is the current date I have for the possible mini crash Low is directly linked to those dark days!  (Yellow projection line on chart does not give the exact date)  That date is also a Major Time and Cycle Cluster as it has 2 Time Squares CITs, the dark day CIT and several cycles all suggesting a Major CIT on that date. Caveat: If that date is not the mini crash Low, it will be the High to get short for a sharp 150+ SP decline afterwards. In any case, it should be an important turning point to watch in the markets. 

Tuesday, April 26, 2016

Raj Time and Cycles Review and Forecast: 4/26 Low

http://safehaven.com/article/41240/raj-time-and-cycles-review-and-forecast-426-low

In my last public T&C Blog post, we were looking for The next major Time Square CIT (Change in Trend ) is due on April 13 +/-1 day.


Actual: The Time Square CIT (Change in Trend = High or Low) has several impressive past hits, including: 8/24/15L, 9/29/15L, 11/3/15H, 12/11/15L+1, 1/19/16L+1, all of them Major swing Lows and Highs (vertical red lines on chart) and the next one that was due on 4/13/16 was the April 12 2016 Low.

Forecast from the 4/10 Raj T&C Weekend report: The Cycle bias is we see a 4/11-12L at the 4/11 Geometric CIT and the 4/13 Time Square CIT. From there we rally into 4/20-22H and then decline into 4/26L


Actual: We made an 4/12 Low (Forecast #1 on chart), which was the 4/13 Time Square Low and rallied into 4/20 High (Forecast #2), right at the 4/20 Solar and Geometric Time CIT. From there we declined into 4/25 Low, 1 day from (Forecast #3) the 4/26 Geometric Time CIT.

What’s Next: We make an 4/26 Low+/-1 and start another rally phase. There is an important Time and Cycle Cluster on the Horizon that will cause some major movements in the markets. Be prepared.

Intraday Times and Cycles 4/26/16

Good Morning,

Globex futures have been higher all night.

Often (80%), though not always we see the High of Day right at the open or in the 1st hour of trading.

Daytraders: The intraday cycle sees a 1st hour 10.20 Low, midday Low and last hour Low.

We gapped higher to a 10.05 Mebob High and saw a 10.15 Low so far. 

Today appears to be the inverse of yesterday and suggests after some initial strength, we sell off into the close.,

Intraday 5 min SPX CIT Times 4/26/16: 10.15, 11.20-25, 12.40, 2.15 pm Eastern

Actual: 10.05H, 10.15L

Intraday Cycle is the Pink lines (9.40H), 10.20L, 11.15H, 12.30L, 2.00H, 3.40L

Actual: 10.05H, 10.15L+

Tuesday sees a possible 9.40 cycle High+/-, decline to a 10.20 cycle Low at the 10.15 time CIT, rally to a 11.15 cycle High at the 11.20-25 double Time CIT, decline to a 12.30 cycle Low at the 12.40 time CIT, rally to a 2.00 cycle High at the 2.15 time CIT, decline to a 3.40 cycle Low+/-30 min.

Thursday, April 21, 2016

Intraday Time and Cycles 4/21/16


Intraday 5 min SPX CIT Times 4/21/16: 9.35-45, 11.45, 12.55, 2.05 pm Eastern

Intraday Cycle is the Pink lines (9.40H), 10.20L, 11.15H, 12.30L, 2.00H, 3.10L

Thursday sees a possible 9.40 cycle High at the 9.35-45 time CIT, decline to a 10.20 Low+/-30, rally to a 11.15 cycle High at the 11.45 time CIT, decline to a 12.30 cycle Low at the 12.55 time CIT, rally to a 2.00 cycle High at the 2.05 time CIT, decline to a 3.10 cycle Low+/-30 min.


2.20 pm Update

Actual:


Intraday 5 min SPX CIT Times 4/21/16: 9.35-45, 11.45, 12.55, 2.05 pm Eastern

Actual: 9.35H, 11.55H, 12.45H, 2.05L

Intraday Cycle is the Pink lines (9.40H), 10.20L11.15H, 12.30L, 2.00H, 3.10L

Actual: 9.35H, 10.10L, 11.05H, 12.05L, 12.55H, 2.05L

Wednesday, April 13, 2016

The next major Time Square CIT is due on April 13


Forecast #1: From the 3/17 Raj T&C Daily Email: The cycle bias remains we are higher into 3/18-21H at the 3/21 Solar and daily Apex CIT High and decline into 3/28L at the 3/24 and 3/28-29 double Geo CIT”
Actual: We topped on 3/22 High (#1 on chart), 1 TD from the 3/21 Solar Time CIT (Change in Trend), then declined into 3/24 Low (#2 on chart) at the 3/24 Geometric time CIT and 1 TD from the 3/28-29 Geometric Time CIT.


Forecast #2: From the 3/17 Raj T&C Daily Email:  “From the 3/24-28 Low, we then rally into 3/31 CIT High”
Actual: We rallied into 4/1 High (#3 on chart), at the 4/1 Geometric time CIT and 1 day from the 3/31 Solar time CIT.

Forecast #3: From the 3/17 Raj T&C Daily Email: “The cycle bias is from the 3/31-4/1H, we see another decline into 4/8-11L
Actual: From the 4/1 High, we declined into 4/7 Low and we have retested that Low on 4/12L.

What’s Next: The next major Time Square CIT is due on April 13.


The Time Square CIT has several impressive hits, including: 8/24/15L, 9/29/15L, 11/3/15H, 12/11/15L+1, 1/19/16L+1, all of them Major swing Lows and swing Highs and it is next due on April 13 2016+/-1.

Thursday, April 7, 2016

Intraday Times to watch Thursday 4/7

Intraday Times to watch Thursday 4/7:  10.55 am Eastern  and  2.00-05 pm Eastern.