Friday, December 30, 2016

Raj T&C 2016 Year in Review & Forecasting 2017

http://safehaven.com/article/43358/raj-t-and-c-2016-year-in-review-and-forecasting-2017

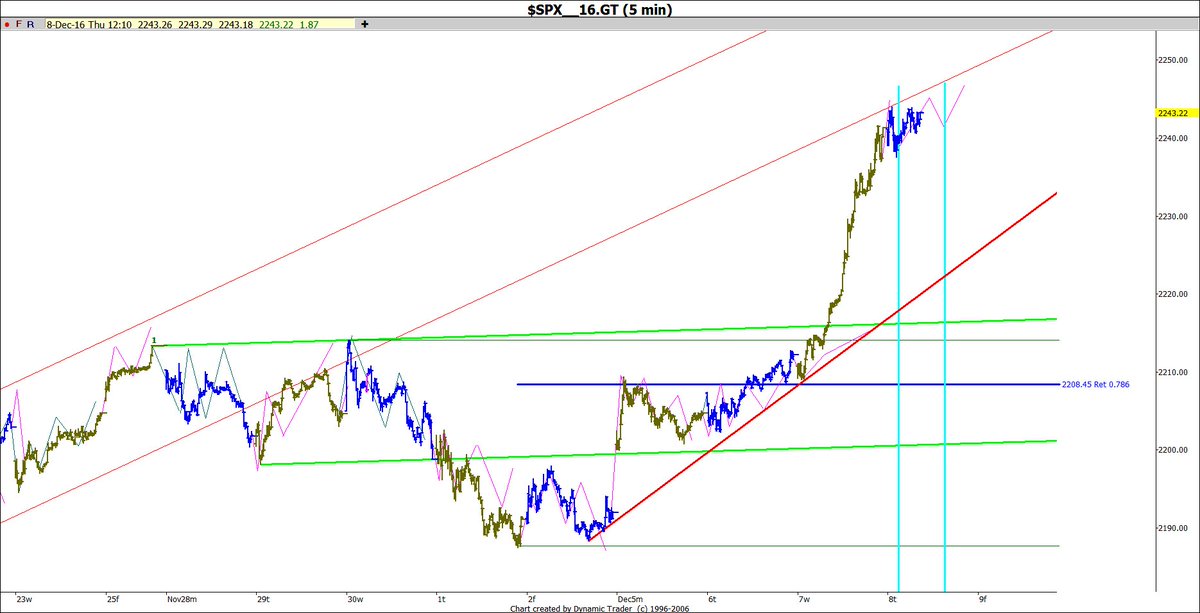
Forecast from my last 12/7 and 12/10 blog post, I was looking for a 12/8-9H and 2245 SPX as long term resistance:  "The long term Geo CIT in CD arrives on Friday 12/9, along with the 12/9 Solar and Ezekiel Wheel CIT. It is allowed to be 1 TD off, so we could see a Monday higher 12/12 High"


Actual: The actual High arrived only 2 TD later at the 12/13H, which remains the High to date, almost 3 weeks later. Price exceeded the long term trend line targets.


What's next: We should decline into our 12/30-1/3 time CIT (Change in Trend) Low and start another rally into XXX major swing High.


2016 Year in review

Many predictions were made in advance and posted on the Raj Time and Cycles public blog in 2016, some were misses, but many of them were direct hits and major High and Lows, within 0-2 days.

Below are some of the 2016 highlights, shown in the public links below:


1. The 1/20/16 Major Low was predicted by the Flash Crash cycle

2.  The 2/11/16 major Low of the year was predicted by The February 2016 SPX Confluence with  Crude Oil and Interest Rates.


3. The 6/27/16 major Low was predicted by the dominant cycle


5. The 11/04/16 major Low was predicted by the 47 TD alternating cycle and the 108 week cycle

Conclusion:  The various Raj Time and Cycles techniques predicted 5-6 major Highs and Lows for 2016, within a day or so, including the 2/11/16 Low of the year. The 47 TD alternating Highs and Lows was prevalent in 2016.

What's next: 2017 and beyond should be historic years and are patiently waiting to unfold.


After extensive research, we are filtering out a handful of the most  important dates to watch in 2017 that shows a high degree of confluence and major Time and Cycles clustering. Won't it be useful to know these dates in advance? At least they have the potential to be tremendously profitable.  2017 should be a volatile year and fortunes can be made if the unique Timing and Cycles proves to be correct. It is best to be well prepared and make 2017 a Happy and prosperous New year.


Saturday, December 10, 2016

Quick Update

Bullish momentum remains strong and as all trends are up, surprises will be to the upside. We do not short this market, until after XXX Date, and then we need to see a reversal lower to confirm.

In the past, in March 01 and Jan 02, that long term 19 year trendline was pierced it by as much as 20 SP’s, then it bounced back. For next week, that would be 2245+ 20 = 2265 SPX, If it rallies beyond that, that would be impressive for sure.

In terms of time, the long term Geo CIT in CD arrives on Friday 12/9, along with the 12/9 Solar and Ezekiel Wheel CIT. It is allowed to be 1 TD off, so we could see a Monday higher 12/12 High.

Wednesday, December 7, 2016

Bulls be aware! 2245 SPX+/-5 is major long term resistance

http://safehaven.com/article/43230/bulls-be-aware-2245-spx-5-is-major-long-term-resistance

Forecast from my last public blogpost on 11/4/16, "The 47 TD Cycle is still suggesting a 11/8 Low +/-3 TD"

From the 11/9 Update: "A solid close above 2155 SPX confirms the 11/4 major Low as the 180 TD/9 Month major Low and we now rally into the next 1-2 months"

Actual: The Cash SPX Low was on 11/4L at 2083.79 SPX, which was a quintuple time CIT, while the Globex SP futures made its Lowest Low on 11/8-9.

From the 11/22 Update: "it is best to use any short term pullbacks to add to longs and just be long until around 12/XX. There is a “Tunnel” Price target at 2239 SPX"

From the 12/1 Update: "There is long term trend line resistance at 2245 SPX+/-5"

Actual: From the 11/4 Low, we rallied so far a whopping 157.84 SP's in one month into 12/7H at 2241.63 SPX, which reached our 2239 SPX Tunnel Price target.


We have rallied into major long term 19 year old major trend line resistance that started from the 10/28/97L, touched 10/8/98L, 3/22/01L, 3/19/02H, 10/11/07H, 5/20/15H, all major Highs and Lows! and now 12/07/16H at 2241.63 SPX. Of course it can pierce this trend line a little, but it suggests limited upside potential as 2242-45 SPX +/-5 should be major resistance.

Thursday 12/8 is a major long term proprietary Geometric Time CIT, that dates back 5 1/2 years ago, from the 5/2/11H.  12/9 is the next Solar CIT and the "Ezekiel Wheel" next CIT is on 12/9. 


There is also a 45 week cycle due this 12/9/16 week that started from the 3/6/09L.

What's next: We should make a Dec 8 High+/-1, targeting 2245 SPX +/-5 and start a retrace, we should then retest these Highs at a long term projected future major High date.


The intraday cycle is a Low am to High pm day, ie, we see a 1st hour Low, often (not always) the Low of Day and a last hour High, often (not always), the High of Day
CzK54AEUQAA1Kbl.jpg
0 replies0 retweets0 likes
Reply


Retweet


Like


View Tweet activity
 
More

Tuesday, November 15, 2016

Intraday Time and Cycles 11/15/16 Review, Forecast versus Actual

Forecast: "The intraday cycle sees a 1st hour High, midday High and last hour High"


Actual: We did see a 10.20 1st hour High, 12.15 midday High and 4.15 last hour High of Day.

Forecast 11/16/16: Tomorrow sees a 1st hour Low, midday Low and last hour Low.

Intraday Time and Cycles 11/15/16

Daytraders: The intraday cycle sees a 1st hour High, midday High and last hour High.

If the midday High is higher than the 1st hour High, it indicates underlying strength and suggests a last hour highest High.

If the midday High is lower than the 1st hour High, it indicates underlying weakness and suggests a last hour lowest High and lower Lows.

Intraday 5 min SPX CIT Times 11/14/16: 10.35, 1.50 pm Eastern

Intraday Cycle is the Pink lines (9.40L), 10.00H, 11.00L, 12.30H, 2.30L, 3.20-50H

Tuesday sees a possible 9.40 cycle Low+/-, rally to a 10.00 cycle High at the 10.35 time CIT, decline to a 11.00 cycle Low+/-30, rally to a 12.30 cycle High+/-30, decline to a 2.30 cycle Low at the 1.50 time CIT, rally to a 3.20-50 cycle High+/-30 min.


    1. We saw a 10.20 1st hour High so far
    2. 2181-82 SPX is resistance.
    3. There is a good chance we erase today's gains by tomorrow's close, which is biased to be lower.
  1. We saw a 12.10H that was slightly lower than the 1st hour High, indicating some underlying weakness and markets are stalling

Friday, November 4, 2016

The 47 TD Cycle predicted the 9/7H and remains on track for a 11/8 Low


Forecasts from my last 10/21 public post"The 47 TD (Trading Days) alternating cycle, mentioned on September 9 2016, was looking for an early September High... 34 TD after the last 47 High is also a CIT...The 41-42 week cycle mentioned in that same post, also topped out at the same time and has an average 107 SP decline...The 47 TD Cycle suggests we see a choppy decline into 11/8 election Low, targeting 2093 SPX or 2069 SPX"


Actual: The last 47 TD cycle was the 9/7H  and 33 TD later, we made an 10/24 swing High and declined a sharp 105 SP's from that 9/7H and 109 SP's from the 8/15H, fulfilling the 41-42 week price targets into 11/4 Low at 2083.79 SPX, close to the 200 DMA at 2082.30 SPX, and 2 TD from the projected 11/8L. 


Numerology & the markets:

108 has been recently actively vibrating: 

It has been 108 years since the Cubs won the World series.

http://www.sanskritimagazine.com/rituals_and_practices/importance-of-108-number/

so I figured 108 must also be active in the markets and found this cycle


108 week+/-1 wk Cycle: 8/27/10L - 9/14/12H - 10/15/14L - 11/08/16 +/-1 week.


There is also a 350 TD cycle that is due on 11/08/16 +/- week. Of course, all the fixed cycles can and do expand or contract, so the Low could already be in today 11/4, but there is a real election angst that should cause choppiness to lower into 11/8.

What's Next: The 47 TD Cycle is still suggesting a 11/8 Low+/-3 TD.

Friday, October 21, 2016

The Dominant alternating cycle

http://safehaven.com/article/42824/the-dominant-alternating-cycle

I first mentioned the 47 TD alternating cycle back on September 9 2016, when it was looking for an early September High. The 41-42 week cycle mentioned in that same post, also topped out at the same time and has an average 107 SP decline. 


The dominant 47 TD (Trading Days) alternating High and Low cycle has been in the markets since late September 2015 and suggests a 11/08/16 Election Low, with a minimum 2093 SPX channel Target.
                                                                                 
1. 09/29/15L - 12/02/15H, Low to High.
2. 12/02/15H - 02/11/16L, High to Low.
3. 02/11/16L - 04/20/16H, Low to High.
4. 04/20/16H - 06/27/16L, High to Low.
5. 06/27/16L – 09/07/16H, Low to High.
6. 09/07/16H – 11/08/16L, High to Low is next!

Also notice 34 TD, after the 47 TD Cycle High or Low is also a CIT (High or Low):
  1. 09/29/15L – 11/16/15L = 34 TD
  2. 12/02/15H – 01/20/16L = 32 TD
  3. 02/11/16H – 04/01/16H = 34 TD
  4. 04/20/16H – 06/08/16H = 34 TD
  5. 06/27/16L – 08/15/16H = 34 TD
  6. 09/01/16L – 10/19/16H = 33 TD


The Dow Jones
down channel support touches the 61.8% retrace by 11/8. If we do the same 61.8% in the SPX we will target 2069 SPX at the 200 DMA.

Conclusion:  The 34 TD CIT of the 47 TD Cycle arrived 1 day earlier at the 10/19H at 2148.44 SPX, which was a double Top with the 10/14 Apex CIT High at 2149.19 SPX.  From the 10/19H, the 47 TD Cycle suggests we see a choppy decline into 11/8 election Low, targeting 2093 SPX or 2069 SPX and a strong rally afterwards.