Monday, January 14, 2019

From 12/26 FC Low into 1/11/19 swing High

From our last public 12/24/18 post: "Markets are right on schedule (for the 75 week Flash Crash Low)"

From 12/26/18 Raj T&C Daily Email: "The infamous Flash Crash 75 week cycle pinpointed the 9/21/18 major High and has been declining into the 12/24-27 Flash Crash week Lows at the 12/27-1/02/19 quadruple time CITs and the 12/21-28 Cycle Cluster. The swing cycle is looking for a 12/24-27 Flash Crash Low and a rally into 1/11/19H"


Actual: The markets bottomed on 12/26 major FC Low at 2346.60 SPX and has rallied a whopping 251+ SP's into 1/10-11H.


From Friday 1/11 Update: "We have a last hourly time CIT that is biased to be the HOD (High of Day) and if seen, then Monday gaps lower and is baised lower"


Actual: We saw a last hour HOD Friday and Monday is gapping lower as expected.


What's next: From the 1/11 swing High, we start a volatile decline.


Join our free forecasts and Updates at: 
https://twitter.com/TimeandCycles 
Email: timeandcycles@gmail.com

Tuesday, December 25, 2018

Thursday, December 20, 2018

The Flash Crash cycle is in progress right now

From 12/12 Twitter and public blog update:
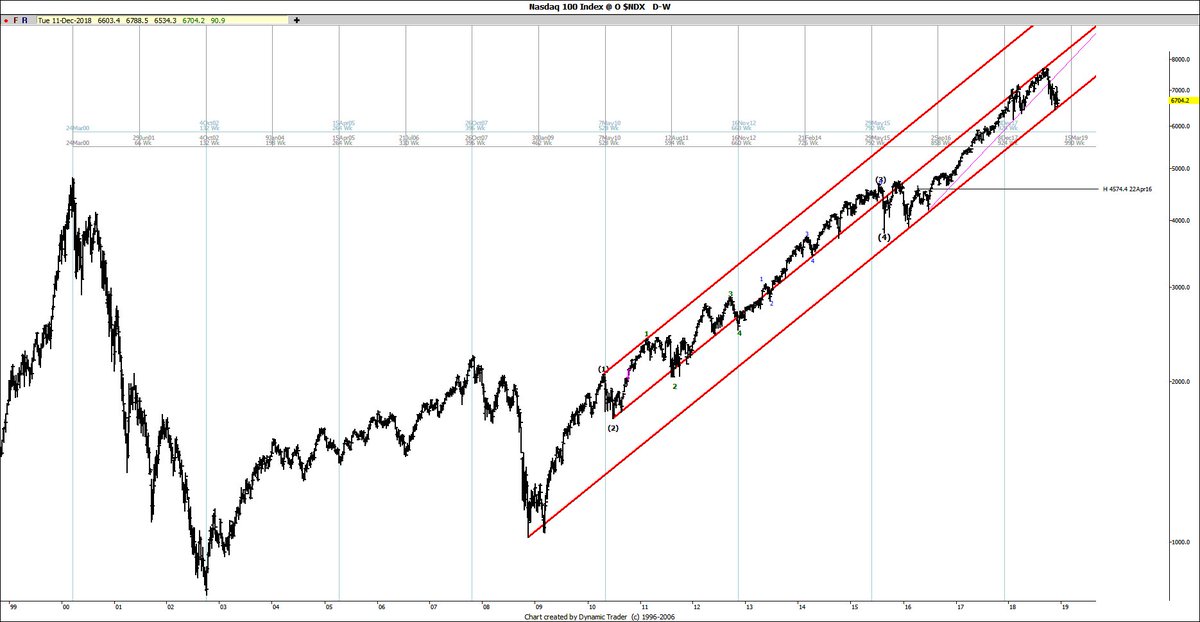
NDX is at long term channel support, a break below could trigger the Flash Crash cycle wave due in December 2018

I have written extensively about my discovery of the Flash Crash (FC) cycle in past posts 

I first mentioned the Flash Crash cycle back in May 2010, when the Flash Crash happened and I discovered then there was a regular Flash Crash cycle, which is a Gann 360 TD/525 Calender day/75 week crash cycle.

On September 2011 for example, the FC cycle was predicting an October 2011 FC Low: http://timeandcycles.blogspot.com/2011/09/flash-crash-cycle.html

Actual: We saw an 10/4/11 major Low


The Flash Crash 525 CD cycle 
04/14/00L - 09/21/01L = 525 CD = 75 weeks = 2.618 X 200 CD = 523.6
04/14/00L - 03/12/03L = 1062 CD = 2.02 X 525 CD = 03/12/03 Major Low
04/14/00L - 08/13/04L = 1582 CD = 3.01 X 525 CD = 08/13/04 Major Low
04/14/00L - 11/21/08L = 3143 CD = 5.99 X 525 CD = 11/21/08 Major Low,
04/14/00L - 05/06/10L = 3674 CD = 7.00 X 525 CD = 05/06/10 flash Crash,
04/14/00L - 10/14/11L = 4200 CD = 7.98 X 525 CD = 10/04/11L, Major Low.


The Flash Crash 75 week cycle 
04/14/00L – 09/21/01L = 01 X 358.00 TD = 01 X 525 CD = 01 X 75.00 weeks
04/14/00L – 03/12/03L = 02 X 363.50 TD = 02 X 531 CD = 02 X 75.86 weeks
04/14/00L – 08/13/04L = 03 X 362.00 TD = 03 X 527 CD = 03 X 73.33 weeks
04/14/00L – 11/21/08L = 06 X 360.67 TD = 06 X 524 CD = 06 X 74.83 weeks
04/14/00L – 05/06/10L = 07 X 361.14 TD = 07 X 525 CD = 07 X 74.98 weeks
04/14/00L – 10/04/11L = 08 X 360.63 TD = 08 X 524 CD = 08 X 74.82 weeks
04/14/00L – 01/20/16L = 11 X 360.36 TD = 11 X 524 CD = 11 X 74.79 weeks

7 out of 9 FC Cycles saw 7%-26% (avg 12-14%) declines and most are in 2-3 wks
03/24/00H - 04/14/00L was a 14% decline in 3 weeks
08/31/01H - 09/21/01L was a 20% decline in 3 weeks
01/31/13H - 03/12/03L was a 16% decline in 8 weeks
06/24/04H - 08/13/04L was a 7% decline in 7 weeks
11/04/08H - 11/21/08L was a 26% decline in 3 weeks
04/26/10H - 05/06/10L was a 12% decline in 3 weeks
09/16/11H - 10/04/11L was a 12% decline in 2 weeks


The 360 TD Cycle is about 75 weeks, which has been in the markets ever since the April 14 2000 mini Crash Low and has since pinpointed 8 major crash Lows in the past 17 years, including the 4/14/00 mini crash Low, 9/21/01 crash Low, 3/12/03L, 8/13/04L, 11/2108 crash Low, 5/6/10 Flash Crash, 10/04/11 Low and more recently the 1/20/16 crash Low.

Many of the 360 TD/75 week flash crash cycle Lows were major Panic Lows, like the 4/14/00 Low, 9/21/01 Panic Low and the 11/21/08 Banking crisis Low. A few, like the 3/12/03 Low and 8/13/04 Low were not Panic Lows, but still major Lows.  At times the FC Cycle skips a beat, out of the last 12, 8 (67%) were direct hits and 4 (33%) were misses.

Conclusion: The 360 TD Flash Crash Cycle predicted many crashes and major Lows in the past, including the 4/14/00 crash Low, 9/21/01 crash Low,  3/12/13 Low, 8/13/04 Low, 11/21/08 crash Low, 5/6/10 FC, 10/04/11 crash Low, 1/20/16 Crash Low and now again in December 2018 Lows. Some were misses, but in general, it is a regular cycle to be reckoned with.The Flash crash (FC) cycle, once active sees an average 12-14% decline in a few weeks. As the Flash Crash (FC) Cycle is a 1 1/2 year fixed cycle, it will have a +/- variance of a few weeks, so timing the exact Low will be Key as once the Flash Crash cycle bottoms, we will see a sharp rally afterwards.


Join our free forecasts and Updates at: 
https://twitter.com/TimeandCycles 
Email: timeandcycles@gmail.com


Wednesday, December 12, 2018

Flash Crash cycle

NDX is at long term channel support, a break below could trigger the Flash Crash cycle wave due in December 2018

Tuesday, December 11, 2018

December 10 swing Low

In my last public updates on 11/25 and 11/26, we were looking for a 11/23-26 swing Low.

From the 11/25 Raj T&C weekend Report: "We are declining into the 11/23-26 T&C Cluster suggesting a 11/23-26 swing Low (#1 on chart), we should then rally into 12/3H (#2) and see another decline into 12/10L (#3). We are expecting a hard retest of that 11/26L at the 12/10L. There is an outstanding 2580 SPX flagpole target"


Actual: We bottomed on 11/23 Low, rallied 169.10 SP's into 12/3 High and saw a sharper 217 SP decline into the 12/10 Lows, reaching our 2580 SPX Flagpole target.


What's Next: 12/10 should be another swing Low and we start another sharp rally into XXX swing High and see another decline afterwards.


Join our free forecasts and Updates at: 
https://twitter.com/TimeandCycles 
Email: timeandcycles@gmail.com

Monday, November 26, 2018

Sunday, November 25, 2018

11/26 Time & Cycle cluster swing Low

Time CIT (Change in Trend) Cluster

1. 11/23 proprietary Solar time CIT*
2. 11/26-27 double proprietary Geometric time CIT**
3. 11/28 Long term Geometric time CIT**
4. 11/26 Time Square CIT


Time Squares from 4/26/10H is next due on 11/26/18:
46 =2/10/16L+1
47=5/13 miss
48 =8/16H-1
49 =11/21/16
50 = 2/28/17HH+1
51 = 6/9L minor 
52 = 9/20 minor High
53 = 1/3/18H-2
54 = 4/20/18H-2
55 = 8/7/18H
56 =11/26/18


Cycle CIT Cluster

1. 238 CD Cycle: 12/29/14H - 8/24/15L - 4/20/16H(+2) – 8/8/17H (+1) – 4/2/18L -11/26/18

2. 109 TD Cycle: 4/20/16H-108-9/22/16H-109-3/1/17H-110-8/8/17H-109-1/12/18-109-6/20/18-109-11/23/18

3. 55 TD+/-3 (80 CD) Cycle:  9/22/16H-57-12/11/16H-52-3/1/17H –55- 5/18/17L-55- 8/8/17H-55-10/25/17L-52-1/10/18L-55-3/30-55-6/19-55-9/6-55-11/23/18

4. The 24 Year inverted cycle has recently 5 consecutive inverted hits and suggested an inverted 11/23H+/-2, but it is now looking as if we will now see a 11/23 Low instead.

24 Year Analog
Tom McClellan (https://www.mcoscillator.com/) mentioned a 24 Yr cycle, where the Highs and Lows were very similar in this 2 X 12 year Jupiter Cycle. It is not a precise cycle and several times the dates are inverted.
1/31/94H = 1/26/18H (+3)
4/04/94L = 4/02/18L (-2)
4/19/94L = 4/18/18H (Inverted, -1)
5/03/94H = 5/03/18L (Inverted)
5/11/94L = 5/14/18H (Inverted, +3)
6/15/94H = 6/13/18H (-2)
6/27/94L = 6/28/18L  (+1)
8/31/94H =  8/29/18H (-2)
9/12/94L = 9/11/18L
9/15/94H = 9/17/18L Inverted
9/21/94L =  9/21/18H Inverted
9/28/94H =  9/26-28/18L Inverted
10/5/94L = 10/03/18H (-2) Inverted
10/31/94H = 10/29/18L (-2) Inverted
11/23/94L = 11/26/18H/L
12/09/94LL =

Conclusion: We are declining into 11/26 Time & Cycle Cluster Low, suggesting a 11/26 swing Low is in the make.


Join our free forecasts and Updates at: 
https://twitter.com/TimeandCycles 
Email: timeandcycles@gmail.com

Friday, November 9, 2018

Forecast Review versus Actual

From 10/31 Public Post: 10/29 Apex CIT swing Low


Forecast Review from 10/29 Weekend report:  "The cycle bias: 10/29-30L at the Friday 10/29 Apex CIT, 10/26 Astro CIT, CD to TD CIT. From there we rally into 11/6H at the 11/5-6 triple Geo & 11/7 Solar time CIT"


Actual: We bottomed on 10/29L (#1) and saw a sharp rally into 11/7H (#2)

What's Next: we decline into the next Time & Cycles swing Low and see another rally into the next Time & Cycles swing High.

Tuesday, November 6, 2018

Intraday trade and times to watch

  1. Intraday CIT (Change in Trend, High or Low) Times to watch today: 9.55 am, 10.15, 10.30, 2.20 pm Eastern, all +/-5 min
  2. Any Daytraders out there? If 9.55 am Eastern is a Low, buy it for a rally to a 1st hour High around 10.30. The intraday cycle sees a 1st hour High, midday High and last hour High. If the midday High is higher than the 1st hour High, it suggests a last hour highest High and Vice Versa

Wednesday, October 31, 2018

10/29 Apex CIT swing Low


10/29 swing Low was 1 day from the Friday 10/26 Astro Time Cluster: MidPoint VeR&D, Ve conjunct Su, Ve combust +/-3 CD & Calendar Days to Trading Day Technique due on 10/26 and exact on Monday's 10/29 Apex CIT and 1 day from 10/30 Geo time CIT. 

Wednesday, October 24, 2018

Time & Cycle review and what's next: 10/23 swing Low

Forecast #1 & #2 from 10/3 T&C Update: "We should now rally into 10/4 Quintuple time CIT cluster (#1 on chart), 10/3 Solar and 10/4-5 quadruple CIT. From there we decline into 10/11L (#2 on chart) at the 10/10 Solar & 10/12 Geo CIT and next 8 TD Hurst cycle Low."

Forecast # 2 from 10/11 public post: "We are now declining into the projected 10/11 short term Low.... We should then see a sharp rally followed by another test of the Lows...Timing will be critical..."


Forecast #3 & #4 from 10/17 T&C Update: "We are seeing an 10/17H at the 10/16 Geo and 10/17 Solar CIT. From there we decline into 10/22L at the next 8 TD Hurst & 143 CD cycle Low"


Actual:  
1. We topped out at the 10/3H (#1) at the quintuple time cluster.
2. We then saw a sharp 229.35 SP mini crash decline into the projected 10/11L (#2) at the 10/10 Solar &10/12 Geo CIT and next 8 TD Hurst cycle Low.
3. We then saw a sharp 106.43 SP countertrend rally into 10/17H (#3) at the 10/16 Geo and 10/17 Solar CIT.
4. We have now declined into the projected 10/23L (#4) at the 10/23 Geo and 10/24 Solar time CIT at the next 8 TD cycle Low and 143 CD Low.

What's next: From the 10/23 swing Low, we see another sharp rally phase into the next projected Time & Cycle High, before we see another sharp decline. Timing remains critical.


Join our free forecasts and Updates at: 
https://twitter.com/TimeandCycles 
Email: timeandcycles@gmail.com