This is a stockmarket site for both intraday and swingtraders, trading the SP emini,ETF's like QLD, SSO, etc. Various Timing techniques and Cycles are researched. Precise Timing is everything. Both Intraday and daily Change in Trend (CIT) Times are calculated through several unique timing methods that are often exact or off by mostly +/- 5-10 minutes for intraday times and +/-1 day for the daily CITs. All the different Cycles in the SP 500 markets are discussed.
Thursday, February 14, 2019
Tuesday, February 12, 2019
The 94 Trading Day Cycle 2/12 swing High
Review: From 1/31/19 Update: "Markets have rallied above the mini wave 4 bullish pennant/triangle pattern in a 5th wave rally. The triangle targets 2739 SPX, right at the 200 DMA at 2741.47 SPX, which is major resistance. "
From 2/5/19 Update: "We are rallying into 2/5 Solar time CIT (Change in Trend) suggesting a 2/5H in the make, but as bullish momentum remains strong and all trends remain Up, we go with the flow and wait for a trend reversal lower before considering any shorts"
Actual: We reached our outstanding 2739 SPX Triangle Target, right at the 200 DMA at the 2/5 Solar CIT High, which remains the Highs to date.
We are currently rallying into the next 94 Trading Day (TD) Cycle, that last saw the 9/21/18 major High and is next due 2/11/19+/-3. The 94 TD Cycle has been consistently in the markets for more than 4 years now, since the 12/29/14H and has been often exact, but at times off 3-4 Trading Days.
The same triangle that projected 2739 SPX price target has an Apex CIT due today 2/12, right at the double 2/12 Geometric time CITs and the 94 TD Cycle suggesting a 2/12 swing High being made.
All trends remains up, since the projected 12/26/18 major Low and the markets have been in an hourly up channel. We would need to break this up channel to get an initial Sell signal.
What's Next: We should make a 2/12 swing High+/- and start a retrace.
Email: timeandcycles@gmail.com
From 2/5/19 Update: "We are rallying into 2/5 Solar time CIT (Change in Trend) suggesting a 2/5H in the make, but as bullish momentum remains strong and all trends remain Up, we go with the flow and wait for a trend reversal lower before considering any shorts"
Actual: We reached our outstanding 2739 SPX Triangle Target, right at the 200 DMA at the 2/5 Solar CIT High, which remains the Highs to date.
We are currently rallying into the next 94 Trading Day (TD) Cycle, that last saw the 9/21/18 major High and is next due 2/11/19+/-3. The 94 TD Cycle has been consistently in the markets for more than 4 years now, since the 12/29/14H and has been often exact, but at times off 3-4 Trading Days.
The same triangle that projected 2739 SPX price target has an Apex CIT due today 2/12, right at the double 2/12 Geometric time CITs and the 94 TD Cycle suggesting a 2/12 swing High being made.
All trends remains up, since the projected 12/26/18 major Low and the markets have been in an hourly up channel. We would need to break this up channel to get an initial Sell signal.
What's Next: We should make a 2/12 swing High+/- and start a retrace.
Join our free forecasts and Updates at:
https://twitter.com/TimeandCycles Email: timeandcycles@gmail.com
Monday, January 14, 2019
From 12/26 FC Low into 1/11/19 swing High
From our last public 12/24/18 post: "Markets are right on schedule (for the 75 week Flash Crash Low)"
From 12/26/18 Raj T&C Daily Email: "The infamous Flash Crash 75 week cycle pinpointed the 9/21/18 major High and has been declining into the 12/24-27 Flash Crash week Lows at the 12/27-1/02/19 quadruple time CITs and the 12/21-28 Cycle Cluster. The swing cycle is looking for a 12/24-27 Flash Crash Low and a rally into 1/11/19H"
Actual: The markets bottomed on 12/26 major FC Low at 2346.60 SPX and has rallied a whopping 251+ SP's into 1/10-11H.
From Friday 1/11 Update: "We have a last hourly time CIT that is biased to be the HOD (High of Day) and if seen, then Monday gaps lower and is baised lower"
Actual: We saw a last hour HOD Friday and Monday is gapping lower as expected.
What's next: From the 1/11 swing High, we start a volatile decline.
Email: timeandcycles@gmail.com
From 12/26/18 Raj T&C Daily Email: "The infamous Flash Crash 75 week cycle pinpointed the 9/21/18 major High and has been declining into the 12/24-27 Flash Crash week Lows at the 12/27-1/02/19 quadruple time CITs and the 12/21-28 Cycle Cluster. The swing cycle is looking for a 12/24-27 Flash Crash Low and a rally into 1/11/19H"
Actual: The markets bottomed on 12/26 major FC Low at 2346.60 SPX and has rallied a whopping 251+ SP's into 1/10-11H.
From Friday 1/11 Update: "We have a last hourly time CIT that is biased to be the HOD (High of Day) and if seen, then Monday gaps lower and is baised lower"
Actual: We saw a last hour HOD Friday and Monday is gapping lower as expected.
What's next: From the 1/11 swing High, we start a volatile decline.
Join our free forecasts and Updates at:
https://twitter.com/TimeandCycles Email: timeandcycles@gmail.com
Tuesday, December 25, 2018
Thursday, December 20, 2018
The Flash Crash cycle is in progress right now
From 12/12 Twitter and public blog update:
I have written extensively about my discovery of the Flash Crash (FC) cycle in past posts
I first mentioned the Flash Crash cycle back in May 2010, when the Flash Crash happened and I discovered then there was a regular Flash Crash cycle, which is a Gann 360 TD/525 Calender day/75 week crash cycle.
On September 2011 for example, the FC cycle was predicting an October 2011 FC Low: http://timeandcycles.blogspot.com/2011/09/flash-crash-cycle.html
Actual: We saw an 10/4/11 major Low
The Flash Crash 525 CD cycle
04/14/00L - 09/21/01L = 525 CD = 75 weeks = 2.618 X 200 CD = 523.6
04/14/00L - 03/12/03L = 1062 CD = 2.02 X 525 CD = 03/12/03 Major Low
04/14/00L - 08/13/04L = 1582 CD = 3.01 X 525 CD = 08/13/04 Major Low
04/14/00L - 11/21/08L = 3143 CD = 5.99 X 525 CD = 11/21/08 Major Low,
04/14/00L - 05/06/10L = 3674 CD = 7.00 X 525 CD = 05/06/10 flash Crash,
04/14/00L - 10/14/11L = 4200 CD = 7.98 X 525 CD = 10/04/11L, Major Low.
The Flash Crash 75 week cycle
7 out of 9 FC Cycles saw 7%-26% (avg 12-14%) declines and most are in 2-3 wks
03/24/00H - 04/14/00L was a 14% decline in 3 weeks
08/31/01H - 09/21/01L was a 20% decline in 3 weeks
01/31/13H - 03/12/03L was a 16% decline in 8 weeks
06/24/04H - 08/13/04L was a 7% decline in 7 weeks
11/04/08H - 11/21/08L was a 26% decline in 3 weeks
04/26/10H - 05/06/10L was a 12% decline in 3 weeks
09/16/11H - 10/04/11L was a 12% decline in 2 weeks
Conclusion: The 360 TD Flash Crash Cycle predicted many crashes and major Lows in the past, including the 4/14/00 crash Low, 9/21/01 crash Low, 3/12/13 Low, 8/13/04 Low, 11/21/08 crash Low, 5/6/10 FC, 10/04/11 crash Low, 1/20/16 Crash Low and now again in December 2018 Lows. Some were misses, but in general, it is a regular cycle to be reckoned with.The Flash crash (FC) cycle, once active sees an average 12-14% decline in a few weeks. As the Flash Crash (FC) Cycle is a 1 1/2 year fixed cycle, it will have a +/- variance of a few weeks, so timing the exact Low will be Key as once the Flash Crash cycle bottoms, we will see a sharp rally afterwards.
Email: timeandcycles@gmail.com
NDX is at long term channel support, a break below could trigger the Flash Crash cycle wave due in December 2018
I have written extensively about my discovery of the Flash Crash (FC) cycle in past posts
I first mentioned the Flash Crash cycle back in May 2010, when the Flash Crash happened and I discovered then there was a regular Flash Crash cycle, which is a Gann 360 TD/525 Calender day/75 week crash cycle.
On September 2011 for example, the FC cycle was predicting an October 2011 FC Low: http://timeandcycles.blogspot.com/2011/09/flash-crash-cycle.html
Actual: We saw an 10/4/11 major Low
The Flash Crash 525 CD cycle
04/14/00L - 09/21/01L = 525 CD = 75 weeks = 2.618 X 200 CD = 523.6
04/14/00L - 03/12/03L = 1062 CD = 2.02 X 525 CD = 03/12/03 Major Low
04/14/00L - 08/13/04L = 1582 CD = 3.01 X 525 CD = 08/13/04 Major Low
04/14/00L - 11/21/08L = 3143 CD = 5.99 X 525 CD = 11/21/08 Major Low,
04/14/00L - 05/06/10L = 3674 CD = 7.00 X 525 CD = 05/06/10 flash Crash,
04/14/00L - 10/14/11L = 4200 CD = 7.98 X 525 CD = 10/04/11L, Major Low.
The Flash Crash 75 week cycle
04/14/00L – 09/21/01L = 01 X 358.00 TD = 01 X 525 CD = 01 X 75.00 weeks
04/14/00L – 03/12/03L = 02 X 363.50 TD = 02 X 531 CD = 02 X 75.86 weeks
04/14/00L – 08/13/04L = 03 X 362.00 TD = 03 X 527 CD = 03 X 73.33 weeks
04/14/00L – 11/21/08L = 06 X 360.67 TD = 06 X 524 CD = 06 X 74.83 weeks
04/14/00L – 05/06/10L = 07 X 361.14 TD = 07 X 525 CD = 07 X 74.98 weeks
04/14/00L – 10/04/11L = 08 X 360.63 TD = 08 X 524 CD = 08 X 74.82 weeks
04/14/00L – 01/20/16L = 11 X 360.36 TD = 11 X 524 CD = 11 X 74.79 weeks
7 out of 9 FC Cycles saw 7%-26% (avg 12-14%) declines and most are in 2-3 wks
03/24/00H - 04/14/00L was a 14% decline in 3 weeks
08/31/01H - 09/21/01L was a 20% decline in 3 weeks
01/31/13H - 03/12/03L was a 16% decline in 8 weeks
06/24/04H - 08/13/04L was a 7% decline in 7 weeks
11/04/08H - 11/21/08L was a 26% decline in 3 weeks
04/26/10H - 05/06/10L was a 12% decline in 3 weeks
09/16/11H - 10/04/11L was a 12% decline in 2 weeks
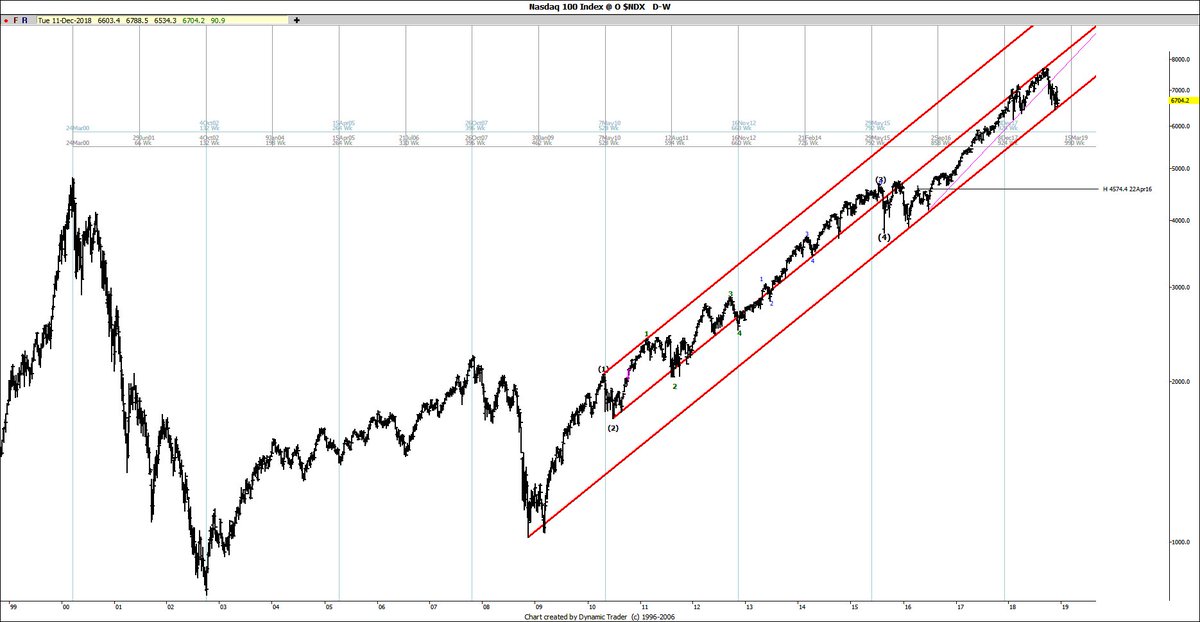
The 360 TD Cycle is about 75 weeks, which has been in the markets ever since the April 14 2000 mini Crash Low and has since pinpointed 8 major crash Lows in the past 17 years, including the 4/14/00 mini crash Low, 9/21/01 crash Low, 3/12/03L, 8/13/04L, 11/2108 crash Low, 5/6/10 Flash Crash, 10/04/11 Low and more recently the 1/20/16 crash Low.
Many of the 360 TD/75 week flash crash cycle Lows were major Panic Lows, like the 4/14/00 Low, 9/21/01 Panic Low and the 11/21/08 Banking crisis Low. A few, like the 3/12/03 Low and 8/13/04 Low were not Panic Lows, but still major Lows. At times the FC Cycle skips a beat, out of the last 12, 8 (67%) were direct hits and 4 (33%) were misses.
Conclusion: The 360 TD Flash Crash Cycle predicted many crashes and major Lows in the past, including the 4/14/00 crash Low, 9/21/01 crash Low, 3/12/13 Low, 8/13/04 Low, 11/21/08 crash Low, 5/6/10 FC, 10/04/11 crash Low, 1/20/16 Crash Low and now again in December 2018 Lows. Some were misses, but in general, it is a regular cycle to be reckoned with.The Flash crash (FC) cycle, once active sees an average 12-14% decline in a few weeks. As the Flash Crash (FC) Cycle is a 1 1/2 year fixed cycle, it will have a +/- variance of a few weeks, so timing the exact Low will be Key as once the Flash Crash cycle bottoms, we will see a sharp rally afterwards.
Join our free forecasts and Updates at:
https://twitter.com/TimeandCycles Email: timeandcycles@gmail.com
Wednesday, December 12, 2018
Flash Crash cycle
NDX is at long term channel support, a break below could trigger the Flash Crash cycle wave due in December 2018

0 replies0 retweets0 likes
Tuesday, December 11, 2018
December 10 swing Low
In my last public updates on 11/25 and 11/26, we were looking for a 11/23-26 swing Low.
From the 11/25 Raj T&C weekend Report: "We are declining into the 11/23-26 T&C Cluster suggesting a 11/23-26 swing Low (#1 on chart), we should then rally into 12/3H (#2) and see another decline into 12/10L (#3). We are expecting a hard retest of that 11/26L at the 12/10L. There is an outstanding 2580 SPX flagpole target"
Actual: We bottomed on 11/23 Low, rallied 169.10 SP's into 12/3 High and saw a sharper 217 SP decline into the 12/10 Lows, reaching our 2580 SPX Flagpole target.
What's Next: 12/10 should be another swing Low and we start another sharp rally into XXX swing High and see another decline afterwards.
Email: timeandcycles@gmail.com
From the 11/25 Raj T&C weekend Report: "We are declining into the 11/23-26 T&C Cluster suggesting a 11/23-26 swing Low (#1 on chart), we should then rally into 12/3H (#2) and see another decline into 12/10L (#3). We are expecting a hard retest of that 11/26L at the 12/10L. There is an outstanding 2580 SPX flagpole target"
Actual: We bottomed on 11/23 Low, rallied 169.10 SP's into 12/3 High and saw a sharper 217 SP decline into the 12/10 Lows, reaching our 2580 SPX Flagpole target.
What's Next: 12/10 should be another swing Low and we start another sharp rally into XXX swing High and see another decline afterwards.
Join our free forecasts and Updates at:
https://twitter.com/TimeandCycles Email: timeandcycles@gmail.com
Monday, November 26, 2018
Sunday, November 25, 2018
11/26 Time & Cycle cluster swing Low
Time CIT (Change in Trend) Cluster
1. 11/23 proprietary Solar time CIT*
2. 11/26-27 double proprietary Geometric time CIT**
3. 11/28 Long term Geometric time CIT**
4. 11/26 Time Square CIT
Time
Squares from 4/26/10H is next due on 11/26/18:
46 =2/10/16L+1
47=5/13
miss
48 =8/16H-1
49 =11/21/16
50 = 2/28/17HH+1
51 = 6/9L
minor
52 = 9/20 minor High
53 = 1/3/18H-2
54 = 4/20/18H-2
55
= 8/7/18H
56 =11/26/18
Cycle CIT Cluster
1. 238 CD Cycle: 12/29/14H - 8/24/15L - 4/20/16H(+2) – 8/8/17H (+1) –
4/2/18L -11/26/18
2. 109
TD Cycle: 4/20/16H-108-9/22/16H-109-3/1/17H-110-8/8/17H-109-1/12/18-109-6/20/18-109-11/23/18
3. 55
TD+/-3 (80 CD)
Cycle: 9/22/16H-57-12/11/16H-52-3/1/17H –55- 5/18/17L-55-
8/8/17H-55-10/25/17L-52-1/10/18L-55-3/30-55-6/19-55-9/6-55-11/23/18
4. The
24 Year inverted cycle has recently 5
consecutive inverted hits and suggested an inverted 11/23H+/-2,
but it is now looking as if we will
now see a 11/23 Low instead.
24
Year Analog
Tom McClellan (https://www.mcoscillator.com/) mentioned a 24 Yr cycle, where the Highs and Lows were very similar in this 2 X
12 year Jupiter Cycle. It is not a precise cycle and several times the dates
are inverted.
1/31/94H
= 1/26/18H (+3)
4/04/94L
= 4/02/18L (-2)
4/19/94L
= 4/18/18H (Inverted, -1)
5/03/94H
= 5/03/18L (Inverted)
5/11/94L
= 5/14/18H (Inverted, +3)
6/15/94H
= 6/13/18H (-2)
6/27/94L
= 6/28/18L (+1)
8/31/94H
= 8/29/18H (-2)
9/12/94L
= 9/11/18L
9/15/94H = 9/17/18L Inverted
9/21/94L = 9/21/18H Inverted
9/28/94H = 9/26-28/18L Inverted
10/5/94L = 10/03/18H (-2) Inverted
10/31/94H = 10/29/18L (-2) Inverted
11/23/94L = 11/26/18H/L
12/09/94LL =
Conclusion: We are declining into 11/26 Time & Cycle Cluster Low, suggesting a 11/26 swing Low is in the make.
Email: timeandcycles@gmail.com
Join our free forecasts and Updates at:
https://twitter.com/TimeandCycles Email: timeandcycles@gmail.com
Friday, November 9, 2018
Forecast Review versus Actual
From 10/31 Public Post: 10/29 Apex CIT swing Low
Actual: We bottomed on 10/29L (#1) and saw a sharp rally into 11/7H (#2)
What's Next: we decline into the next Time & Cycles swing Low and see another rally into the next Time & Cycles swing High.
Tuesday, November 6, 2018
Intraday trade and times to watch
- Intraday CIT (Change in Trend, High or Low) Times to watch today: 9.55 am, 10.15, 10.30, 2.20 pm Eastern, all +/-5 min0 replies0 retweets0 likes
- Any Daytraders out there? If 9.55 am Eastern is a Low, buy it for a rally to a 1st hour High around 10.30. The intraday cycle sees a 1st hour High, midday High and last hour High. If the midday High is higher than the 1st hour High, it suggests a last hour highest High and Vice Versa
Subscribe to:
Posts (Atom)