Thursday, December 17, 2020

12/17-18 is the next swing High

In our 11/27 public Post, the next T&C Cluster was centered on 11/30 and was biased to be High.

Actual: The 11/30 T&C Cluster inverted to a 11/30 Low.


From 12/10 Raj T&C Daily Email: "The cycle bias is we see a 12/10L and we now rally into 12/17H at the 12/15+/-2 Long term Geometric time CIT and 12/17 Solar time CIT"

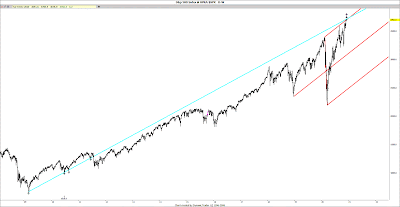
Actual: We made a 12/11L and have now rallied into today's 12/17 proprietary 12/17 Solar time CIT, right at long term Trend line and Fork resistance.

Whats' Next: We see a 12/17-18H at the 12/17 Solar and 12/18 double Geometric short term time CIT and start a next decline into XXX T&C Cluster Low.


Join our free forecasts and Updates at: 

Wednesday, December 9, 2020

Put a Fork in it


Friday, November 27, 2020

You are here: 11/30 High

 From the 11/5 Public Blog: We should make a 11/6-9 swing High, before the next decline. There are more important T&C (Time and Cycles) Clusters remaining in November that should be crucial to watch in the coming weeks.”

From 11/8 Raj T&C weekend Report: Ideally we see an 11/6-9H at the 11/7 weekend Solar time CIT at the 9 TD cycle and a 47/94 TD Cycle due 11/9H. We then see a brief decline into 11/12-13L”

Actual: We made a 11/9H (#1 on chart) and declined into 11/12L (#2) at the 11/12 double Geometric time CIT.


From 11/15 Raj T&C weekend Report: “We have rallied into 11/15 weekend Geo time CIT suggesting a 11/13-16 short term High…If Globex futures are higher, we should see a 11/16H, with a decline into 11/19L at the 11/19 Geo time CIT”

Actual: From 11/12L, we rallied into 11/16H (#3) and declined into 11/19L (#4).  

From 11/20 Raj T&C Daily Update: “We saw a last hour Low today, so Monday 11/23 Solar time CIT will be a 11/23 Low (#4) and we rally into 11/27-30 T&C Cluster High (#5), which includes a Lunar Eclipse”

Actual: We made a 11/23L (#4) and are now rallying into 11/27-30 High (#5)

What’s Next: We should see a 11/30 swing High and start the next decline.


The 11/30 T&C Cluster includes:

1. 11/27-30 double Geo time CIT 

2. 12/1 Solar time CIT

3. 12/1 is  69 Squared weeks from the 9/3/29H (see table below) 

4. 11/29 is the fibonacci 1618 CD cycle from 10/8/98L 

5. 12/1 is the next 9 TD Cycle


11/29: 4.5 Yrs/1618 CD/231 wk Cycle: 10/8/98L-1616-3/12/03L-1618-8/16/07L-1618-1/20/12L (miss)-1618- 6/25/16L-1618- 11/29/20


9/3/29H +

55 Squared weeks = 08/25/87H

56 Squared weeks = 10/10/89H

57 Squared weeks = 12/10/91

58 Squared weeks = 02/22/94H

59 Squared weeks = 05/21/96H

60 squared weeks = 09/01/98L(-308 = 10/28/97L)

61 squared weeks = 12/26/00H

62 squared weeks = 5/6/03

63 squared weeks = 9/27/05

64 squared weeks = 3/04/08 (+308 = 1/06/09H)

65 squared weeks = 8/24/10L+2

66 squared weeks = 2/26/13L (+308 =12/31/13H)

67 squared weeks = 09/15/15H+2 (+308 = 7/19/16+1H)

68 = 4/17/18H+1

69 = 12/01/2020

9/3/29H+69 Squared weeks = 12/1/20.


We should see a 11/30+/-1 swing High.


Join our free forecasts and Updates at: 

Wednesday, November 18, 2020

US$ Dollar Watch


The US$ Dollar is at critical support levels at 91.75.

US$Dollar time CITs: 11/30, 12/11 & 12/24** is major.

Thursday, November 5, 2020

You are soon here: 11/6 High

 In our last blogpost, we were looking for an 10/23 lower High.

From 10/23 Raj T&C (Time & Cycles) Daily Email: The 10/24 weekend Solar time CIT (Change in Trend) sees an 10/23-26H, decline into 10/27 Geo Time CIT, brief rally into 10/29 Geo time CIT and decline into 10/30-11/2L at the 10/31 weekend Geo time CIT”

Actual:  From the 10/23 swing High, we declined into 10/28-29L (#1 on chart), saw a brief bounce into 10/29H (#2) and declined into 10/30 (#3) swing Low.


From 10/31 Raj T&C weekend Report: “Statistics suggests an 80-85% probability we see a 11/4 close > 3391-3401 SPX. From 10/30-11/2L, we see a volatile rally into 11/6-9H at the 11/7 Solar time CIT”

Actual: From the 10/30 swing Low, we are seeing a sharp rally above 3401 SPX into 11/5 (#5) so far. The sharp rally above the 10/23H makes any crash wave unlikely.

What’s Next: We should make a 11/6-9 swing High,  before the next decline. There are more important T&C Clusters remaining in November that should be crucial to watch in the coming weeks.


Join our free forecasts and Updates at: 

Friday, October 30, 2020

You were warned in advance

  "10/23H was right at the down channel resistance and it could trigger the Mother Divine (MD) Crash Cycle, where the last day of MD (10/24) is a High and we start a crash wave, be alert for this possibility."


and those that studied this Mother Divine Cycle carefully from previous posts on it, knows exactly when the Crash Low should occur...It isn't over until it is over.


Sunday, October 25, 2020

The Mother Divine Crash wave starts with an 10/23 lower High

In our last public 9/25 post we were looking for a 9/24-29 swing Low.

Actual: We saw a Sep 24 swing Low at 3209.50 SPX. We have since rallied a sharp 340.40 SP's to an 10/12 High.


Forecast from the 10/3 Raj Time and Cycles (T&C) Daily Email (3 weeks ago): "From 10/1H, decline briefly into 10/2-5L at the 10/3 Solar & 10/2-5 Geo time CIT. We will rally into 10/9-12 T&C cluster High, decline into 10/16-19L"

Actual: We made an 10/1H (#1 on chart), declined briefly into 10/2L (#2), rallied into 10/12H (#3), which was along term Geometric time CIT and declined into 10/19L (#4).

Forecast from 10/19 Intraday Update: "If today 10/19 was a High, we could see an 10/21-22 Low and 10/26 High"

Actual: We declined into 10/22L (#5) at the wedge Apex CIT and are now rallying into 10/26H.

What's next: The coming week should continue to be volatile as we see another short term 10/23 High at the 10/24 weekend Solar Time CIT. 

The 10/24 Solar time CIT, along with the 10/24 Midpoint CIT of Mercury Retrograde and Direct, Venus Debilitated in Virgo on 10/23 and the last day of 9 days of "Mother Divine" (MD) CIT on 10/24 was the 10/23 lower High.

10/23H was right at the down channel resistance and it could trigger the Mother Divine (MD) Crash Cycle, where the last day of MD (10/24) is a High and we start a crash wave, be alert for this possibility.

It is a little esoteric but here is the Mother Divine crash wave Research link:


For more detailed charts: http://timeandcycles.blogspot.com/


Happy Victory Day! 💥


Join our free forecasts and Updates at: 

Friday, October 9, 2020

The "Brahma Muhurta" is the most powerful time of the day


 In Vedic traditions, the day starts at Sunrise and ends at the next sunrise. A Muhurta is a Vedic unit of time that is equal to 48 minutes.  Every day then has 30 muhurtas as 30 X 48 minutes = 1440 minutes = 24 hours = 1 day.The Brahma Muhurta starts 2 muhurtas or 96 minutes (about 1 1/2 hours) before sunrise. 

Literally meaning "The Creator's Hour", it is considered an auspicious time for all practices of yoga and most appropriate for meditation, worship or any other religious practice. Spiritual activities performed early in the morning have a greater effect than in any other part of the day. Each muhurta lasts 48 minutes, and therefore the Brahma muhurta begins 1 hour and 36 minutes before sunrise, and ends 48 minutes before sunrise. 

The time of sunrise varies each day, according to geographic location and time of year, thus the time of the Brahma muhurta also varies. For example, if sunrise is at 6am, the brahma muhurta begins at 4:24am. If sunrise is at 7am, brahma muhurta begins at 5:24am, and so on. 

Brahma muhurtha occurs during the "Vata" phase of the morning, between 2:00am and 6:00am, and Yoga masters state that the best time to meditate is one and a half hours before dawn, because the mind is inherently still at that time, enabling one to achieve a deeper meditative state.


Friday, October 2, 2020

Will we see an October 2020 Panic?


Many wonder why October has often been volatile as we had many historic crashes in October, including 1847, 1857, 1907, 1929, 1937, 1987, 1990, 1997, 2002 and more recently in October 2008 and 2018, to name a few.

The actual hidden reason that October is often "panicky" is that in Vedic Astrology the Vedic Sun, which represents the Self and Self Confidence, is debilitated in Libra every year between Mid October and Mid November. This lack of confidence in the markets often shows up as Panics and crash waves.

In addition, to add fuel to the fire this year:

1. Mars, the planet of War, arguments and aggression is retrogade the whole month of October 2020 (9/9-11/13).

2. Mercury, the planet of Business, communication and trade is retrograding from 10/14 through 11/3.

3. The uncertainty and divisiveness around the USA elections from now into 11/5 is certainly not helping.

4. Venus is debilitated in Virgo from 10/23 through 11/16

5. The "Mother Divine" Crash Cycle could get activated as it is also due in October-November 2020.

I have written about the potential Mother Divine Crash cycle in the past.

Have your popcorn ready as it should be interesting to watch this month unfold.


Join our free forecasts and Updates at: 

Friday, September 25, 2020

September 24-29 Time and Cycles Cluster Low

 From the 9/12 Raj T&C Weekend Report: "We should see a 9/11L or as late as 9/14L at the 9/12 Solar time CIT, rally into 9/16 Geo Time CIT High, before we decline into 9/22-23 Geo and 9/23 JPTL CIT, targeting the 3200-3230 SPX area

Actual: We saw a 9/11L (#1 on chart), rallied into 9/16 proprietary Geometric time CIT High(#2)  and declined into 9/24 Low (#3) at 3209.45 SPX so far.

What's Next: From the 9/23-24 most recent Updates: "Swing traders that were short from 9/16 Geo time CIT High, should take some profits yesterday and today as we are in the window of the 9/24-28 cycle Low."..."The 9/22-23 double Geo & Apex CIT could have seen a 9/23L, but  more likely we saw a 9/23H and reversal lower and we are now down in a sharp C wave into 9/28-29L at the 9/26 Solar weekend and at the 9/29-30 triple Geometric time CIT. Support remains 3200 SPX+/-20, but any decline below 3182.60 SPX confirms a larger C wave decline targeting 3100 SPX area. "


Join our free forecasts and Updates at: 

Friday, September 18, 2020

Intraday Time and Cycles for Sep 18 2020


Pink lines is the normal path of the High am to Low pm day

Green lines is the inverted cycle, ie a Low am to High pm day


The intraday 5 min SPX Time CIT 09/18/20: 9.35, 10.35, 11.00, 2.35 pm Eastern


Intraday Cycle are the Pink lines: (9.40L), 10.30H, 12.30L, 1.30H, 3.30L 

Thursday, September 17, 2020

Review and Forecast: Sep 16 swing High


From the 9/12 Raj T&C Weekend Report: "We should see a 9/11L or as late as 9/14L at the 9/12 Solar time CIT, rally into 9/16 Geo Time CIT High" 

Actual: We made a 9/11L and rallied into 9/16 Geo time CIT and made a High & reversed lower. We now decline into the next T&C Cluster.

Wednesday, September 16, 2020

How one client made 362% YTD returns using the Time and Cycles Information

"I just wanted to say thanks for what you do. Your intraday timings today were amazingly on point.  I was able to take advantage and as a result I did very well. Since I do day trading this is very valuable in addition to the various studies I also use (RSI and MACD). And, over the last three weeks my portfolio has gone from +335% to +362% YTD" 9/16/20 MM

Many clients have their own unique ways of using the Time and Cycles information for their own benefit. I was curious what instruments he used to achieve a 362% YTD as that is unheard off. Below was his answer.

Details how MM made 362% profits:

This is possible if one is willing to do the work required.

What I do has three levels of risk therefore this is NOT something I recommend to anyone else.
But I am willing to share what I do.

 1 – I day trade.
This means I rely heavily on technical info.
I only use fundamentals to get a handle on big picture info in re markets and sectors.
Sometimes it brings my attention to certain stocks.
As a day trader I cash out at the end of the day on average 4 days out of 5.
I only hold overnight when:
I absolutely believe that a particular stock is on a roll.
I also am looking for when, in your daily pdfs, the Executive Summary is in sync with the characterizations you have made about trading days deeper into the report (pg. 8).
When they are in conflict I will not hold overnight.
Your intraday timings are critical for me.
As just one example, when you designate 9:40 am as H and then a CIT at 10:00 or 10:10 with a low at 10:20 or 10:30, rest assured that if have indeed held overnight, I sell that position within 3-4 minutes of the open.
Most of the time I buy the position back lower. Sometimes it continues to go up so I wait until the next Low point.

2 – I day trade options.
They cost a fraction of what the cost is of the underlying equity costs. That’s the good news.
However it is critical to understand however the intrinsic value and the time value of an option is.
I also carefully track and correlate the price of a particular option with the cost of that underlying equity.
Since Schwab’s software (Street Smart Edge) does not do that, I have to do that manually. I do that all day long.
(This is about to change when Schwab acquires TDK Ameritrade and incorporates their Think or Swim software which does.)

3 – I day trade options for “high flyers.”
TSLA, AMZN, NVDA, NFLX, etc.
The advantage is that they typically have a wide trading price range and most importantly, volume.
Low volume is perilous for a day trader.
A day trader seeks to capture a part of the movement (up or down). I often miss some of the movement. I am fine with that.  As Raj says, remember TMAR (Take the Money and Run).
Using the studies as well your technical info I am often able to capture MOST of the movement.

Some other points:
Lastly, I was a stockbroker for 2 years and was the onsite broker at a day trading firm in the earliest days of day trading. 
That education and experience has been vital.
I use two computers.
One has StreetSmartEdge open and it has all my studies for an individual stock:
Price (a line)
Volume (columns)
NASDAQ (a line)
RSI and RSI Stochastic (different colored lines)
MACD and MACD Stochastic (different colored lines)
I use StreetSmartEdge as well to place conditional orders (that includes trailing stops).
The pricing of trailing stops for options is quite strategic but difficult.  I am NOT great at pricing trailing stops for options.

Trading:
On a separate laptop – I keep Schwab.com which displays by default all my accounts at once (I have several).
I often trade option positions for separate stocks in separate accounts. It’s a visual thing. This way by constantly refreshing the screen I can quickly see if I am making (or losing money) in each position (each position being in a separate account).
I keep a backup cell phone on my desk with Yahoo Finance open. I have about 15 different tickers in a watch list and I can see all 15 with their respective reds and greens and thus with a quick glace I see how multiple stocks are moving throughout the day.  It gives a sense how the overall market is doing and how all these are responding.

Before bed:
It’s study time:
CNBC.com, YouTube videos, etc.
When your pdf arrives I set up my manual worksheets for the day.
On those sheets I list the intraday timings as well as various account balances.

I should also mention that another advantage in trading options is that they
settle in just one day (unlike stocks and funds, where you have to wait 48
hours). So I can trade every day without having to wait for cash to be available to
trade with. Therefore if I have cashed out of all positions every day that means 100% of my accounts will be available to trade the next day.

Today's Intraday Time and Cycles for Daytraders:


The intraday 5 min SPX Time CIT 09/16/20: 9.35, 10.45, 11.35, 11.55, 12.50 pm Eastern

Intraday Cycle are the Pink lines: (9.40L), 10.30H, 11.15L, 12.20H, 2.00L, 3.40H 

The intraday cycle sees a a possible 9.40L at the 9.35 time CIT, rally to a 10.30 cycle High at the 10.45 time CIT, decline to a 11.15 cycle Low at the 11.35 time CIT, rally to a 12.20 cycle High at the 11.55 or 12.50 time CIT, decline to a 2.00 cycle Low+/-30, rally to a 3.40 cycle High+/-30 min.


Monday, August 31, 2020

Markets are at 11 yr, 33 yr and 50 Year Long term Channel resistance

Markets are at 11 yr, 33 yr and 50 Year Long term Channel resistance

                                                  SPX Log Monthly Chart resistance

                                                 SPX Weekly Chart resistance

                                                 Expanding triangle resistance


Thursday, August 13, 2020

Buy or sell?

Would you Buy or Sell this mystery chart?  Is it near a Top or Bottom?


Friday, August 7, 2020

The inverted Master Cycle predicts an 8/7-10 High at the 8/7-10 T&C Cluster

From my last blogpost from 7/15: "The Master Cycle (MC) was looking for a 6/29H and a 7/9 major High We saw a 6/29L and a 7/9L instead. An inverted MC suggests a strong rally the next few weeks"


Actual: We did see a rally from 7/9L into today so far and the moment of truth for the inverted MC is if we see an 8/7-10 swing High (Green Lines on chart). 

If we see an 8/7-10 High, the MC would again have 3 minimum "hits" (6/29L, 7/9L & 8/10H) to make the MC useful and predictable again and would predict a relative sharp decline afterwards.


8/7-10 Time and Cycle Cluster:

Time Cluster Daily CIT (Change in Trend) due: 8/10-11

8/10 Geometric time CIT
8/11 Solar time CIT
8/12 Geometric time CIT

Hourly Geometric Time CIT: 8/10 at close to 8/11 at Open

Monday 8/10 in the last hour
Tuesday 8/11 in the 1st hour


The 5 min chart has an Apex CIT cluster on Monday 8/10 as well.


Cycle Cluster CITs due 8/7-10

561 CD Cycle due 8/6+/-
19-20 TD Cycle: 8/6-10
30 TD Cycle: 8/10

Conclusion: We are rallying into the 8/7-10 Time and Cycle Cluster at the 8/7-10 Inverted Master Cycle High, suggesting an 8/7-10 swing High being made.


Join our free forecasts and Updates at: 

Email: timeandcycles@gmail.com

Important Apex CIT is coming Up

Forecast from 8/6 Intraday time CITs: "watch esp. 3.35 pm Eastern"

Actual: 3.25 was the High of the day yesterday and Globex futures are sharply lower

The 5 min chart is showing an important Apex CIT is coming Up.


The intraday 5 min SPX Time CIT (Change in Trend) 08/07/20: 10.10, 10.35, 11.15, 3.45 pm Eastern.


Thursday, August 6, 2020

Intraday Time and Cycles for August 6 2020

The intraday 5 min SPX Time CITs to watch for 08/06/20:
9.35, 1.55, 3.35 pm Eastern, watch esp. 3.35 pm Eastern.
The intraday cycle sees a 1st hour High, midday High and last hour High.
If the midday High is higher than the 1st hour High, it suggests a last hour highest High & Vice Versa.