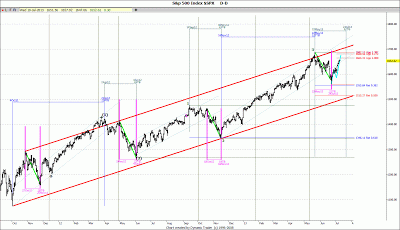
The
weekly SPX touched long term (red) channel resistance at the 5/22/13 All time
High. The
rallies since the 3/6/09 Low has been 44-50 weeks long, the most recent one was
50 weeks long from the 6/4/12L to the 5/22/13H. We rallied right into double
channel & Down trend line resistance, suggesting a pullback is due. A break
above this resistance is bullish short term. The 10/4/11L-6/4/12L (cyan) Up channel
support is at 1500-25 SPX in the coming weeks and should be important support in
any market decline in the coming weeks. Any solid decline and close below 1500 SPX is confirmed bearish.
7/11 Addendum:
Review of the last few weeks: Markets unfolded pretty much as expected:
1. Forecast 6/24/13 in swing cycle Summary: 6/21L, higher into 6/27H, 7/3L
Actual: Monday 6/24 Low, 6/27 High, chop into 7/3 Low
2. Forecast 7/1/13 Swing cycle Summary: 7/3-5L, rally into Medium term Geometric and Solar CIT
Actual: 7/3 Low, rally ever since

The weekly
Bond markets Interest Rates made a regular long term 93 week cycle major Low
(and Bond High) at the 7/25/12 Low at 24.52, piercing below the double bottom
at 25.10-25.19 and have rallied ever since.
The next 93 wk cycle is due in April 2014. We rallied
to the 7/5 High of the week at 36.77, which is bullish for IR and bearish for
Bonds.
We
are rallying into the 508 TD Bond Cycle due around July
8 2013, close to the 7/12 Time CIT (change in Trend) suggesting a short
term High is due. Daily
Time CITs: 7/12, 7/22, 8/27, 10/4, 10/21
The Gold Index Daily closed lower last week at 93.50 and remains in the
steep bear market. This market should
retest 67.42 the 10/08 Lows. The break down in Gold stocks was further confirmed when we took out the 5/16/12L at 164.72. Medium Term Gold Index CITs: 9/12, 11/19
The Gold weekly chart closed sharply lower last week at 1212.70 and has
retraced about 55% of the 11/08L-911H. The trend was confirmed Lower,
when we closed below Long term Make or Break (MOB) support, the June 2005 and
Nov 2008 Up trend Line, this will become resistance at 1418. The 618% retrace
support is at 1153.50. There is a 162
week Cycle due 9/6/13 week. There is a 124 week Cycle due 11/15/13 week. Gold weekly CIT: 10/18/13
week
Dollar Daily Index
There is normally
an Inverse relationship between the stock markets and the US Dollar. If
the dollar sees a strong rally, the stock market declines and vice versa.
The Dollar 220 TD (Green) Cycle was the
6/13/13 Low. It closed higher last week
at 84.71, after making a 6/13 Low, closing above the double Top on 5/23/13H at
84.59, with the 7/24/12H at 84.16, which is bullish.
The Long term monthly dollar chart has been
in a large sideways triangle since the Dec 2005 Highs and has resistance at 86.50. Monthly CITs: August & November 2013.
The weekly Crude Oil is bullish as it
closed near its highs last week at 103.22, right on the larger long term
Triangle since the 5/2/11 Highs, just over 2 years now, with resistance at
103.00 and support at 84.37. Whichever way it breaks will determine the next
major direction. There is a 153 week cycle due August 9 2013. There is a long term 61 month cycle of Lows
due in March 2014 Lows.


