Thursday, March 4, 2021

This mysterious cycle suggests a 3/4 short term Low

In the Feb 23 public blogpost, we mentioned the secret ingredient in many crash waves and

in  the Feb 9 public blogpost, we discovered a historic dominant active cycle that is repeating and is +/-3 TD (Trading Days). For a historic cycle to be "active", it has to have atleast 3-5 direct "hits", ie repeating historic Highs and Lows. Currently this cycle has 13 hits. These cycles are rare and not found often, probably due to manipulation. They are Time Cycles and does not always predict Price magnitude.

From my 2/23 Raj T&C Daily Email: "The active cycle suggests volatility, but is generally lower into a 3/4 Low, Shorter term, we see a 2/23L (#1, see chart), 2/24H (#2), decline into 2/26L (#3), 1 day rally into 3/1H (#4) and decline into 3/4L (#5)"

Actual: From the 2/16H, we saw a 2/23L, 2/24H, 2/26L, 3/1H and 3/4L, all +/-0 TD.


This active cycle has a variance of +/-3 TD and it currently has 13 hits so far:

1. 03/23/20L-3 

2. 06/08/20H-3

3. 09/02/20H+1 

4. 09/24/20L+1

5. 10/12/20H+3 

6. 10/30/20L+0 

7. 01/04/21L-2

8. 01/15/21L-3

9. 02/11/21HH+ 1 1/4 TD = 2/16/21HH

10. 02/23/21L+0

11. 02/24/21H+0

12. 02/26/21L+0

13. 03/01/21H+0 

14. 03/04/21L+/-0?


Conclusion: The markets have been unfolding as the dominant active cycle predicted with surprising mysterious precision with the last 4 Highs and Lows being +/-0, which has been a fortune making feat, however we still do not expect perfection in any future forecast and trade as it can be generally off by +/-3 TD. 

What's next: The dominant active cycle is looking for a 3/4 short term Low, but Volatility should continue, as the largest moves are yet to come.


Join our free forecasts and subscribe at: 


Tuesday, February 23, 2021

The secret ingredient in many crash waves


In Vedic Astrology, there's an ancient Demon (Rakshasa) that was split in a fierce battle into two parts, the upper half of the Demon's Body, Rahu is the Moon's ("True") North Node and the lower half of the body is Ketu, the Moon's South Node, which causes the Solar and Lunar Eclipses.

Whenever these malefic Nodes comes into hard angles (0, 90, 180,
270 degrees) aspect with another big malefic, Mars, the planet of War,
it often produces some intense and violent conflicts and Change in Trends (CIT).

Some examples of Mars Rahu aspects from the past:

Mars squares Rahu: between 7/4/90 and 8/20/90, exact aspect was on
7/23/90. The market declined from 7/13/90 into 8/23/90.
Mars squares Rahu: Between 9/20/97 and 10/30/97, exact aspect was on
10/25/97. The market declined from 10/8/97 into 10/28/97.
Mars conjuncts Rahu: Between 9/27/98 and 11/17/98, exact aspect was
on 10/8/98. The market declined from 9/24/98 into 10/8/98.
Mars squares Rahu: Between 10/25/00 and 12/13/00, exact aspect was
on 11/29/00. The market declined from 11/6/00 into 12/21/00.


The Mars opposite Rahu (Moon's North Node) Crash Cycle.


1. Mars opposite Rahu: between 9/25/29 and 11/7/29, exact aspect was on 10/24/29. The market crashed from 10/11/29H into 10/29/29L

2. Mars opposite Rahu: between on 9/29/87 and 10/30/87, exact aspect was on 10/12/87. The market crashed from 10/2/87H into 10/20/87L.


3. Mars opposite Rahu: between 8/25/01 and 10/18/01, exact aspect was on 9/14/01. The market crashed from 8/27/01H into 9/21/01L.


Notice that in the 3 examples above, the Mars Opposition Rahu played a direct role in the 3 biggest Crashes of the last Century."

The 3 largest historic Crashes had Mars opposite Rahu (The Moon’s North Node) (exact) =  9/14/01! = 10/12/87! = 10/24/29!

The statistical odds that this was due to chance is very low.


Here are some recent examples:

Mars 180 True Node 06/15/2008 02:32 => crashed into 7/15/08L

Mars 180 True Node 07/23/2011 17:34 => crashed into 08/09/11L

Mars 180 True Node 09/25/2018 23:17 => crashed into 12/26/18L

Mars 180 True Node 02/25/2020 13:07 => crashed into 03/23/20L

From the 2/25/20 blogpost: “When Rahu is in certain degrees of Gemini and Ketu is in certain degrees of Sagittarius (in Vedic Astrology), we often see global tragic and crisis events. This was mentioned back in my December 2019 blogpost

The 18.6 Year Cycle of Rahu in Gemini and Ketu in Sagittarius:

1. 1927: Worst Earthquake in Xining, China, 200,000 Deaths
2. 1945: Bombing of Hiroshima, 8/6-9/45

3. 1963: Assassination of President Kennedy, 11/22/63

4. 1982: Aids Virus

5. 2001: Twin Towers, 9/11/01 was triggered by Mars Passover the 07/05/01 Solar Eclipse.

6. 2020: Corona Virus, 2/22/20 was triggered by Mars Passover the12/26/19 Solar Eclipse.

Rahu is in 6.40-20 min degrees in (Vedic) Gemini in Ardra Nakshatra (Teardrop Stargroup)= 9/26/19 -4/22/20 

Ketu is in 0-13.20 min degrees in (Vedic) Saggitarius in Mula Nakshatra (destruction Stargroup) = 2/12/20- 9/20/20

When both 1. Rahu is in Gemini in Ardra stargroup and  2. Ketu is in Saggitarius in Mula stargroup, we get this time frame between 2/12/20-4/22/20: we get the concentration of energy of destruction, explosion & tragic events.”


In last year’s 2/25/20 & 2/28/20 public post, we predicted the transits of Mars over the recent Solar Eclipse and the Mars opposite Rahu Crash cycle would trigger a crash wave, which it did and the crash wave bottomed on 3/23/20L.

http://timeandcycles.blogspot.com/2020/02/

Now, in Sidereal Astrology, Mars conjuncts Rahu, the top part of the Demon, the Moon's North node. They are conjunct, ie in the same house of vedic Taurus, the Bull, on 2/21/21. 

 Bitcoin made its ATH on 2/21/21 and dropped 20% in 1 day.


A word of caution: Not all Rahu Mars hard angles will produce crashes, but often when crashes occur, they seem to be a trigger. The purpose of this article is not to make people fearful and no one should depend on any crashes to make money and they certainly should not trade on this information alone. What I do suggest is take the time to study the statistical data presented, you might find it a very valuable tool.

Conclusion: The secret ingredient that is in many crashes are the hard angles (0, 90, 180) of Mars and Rahu. We currently have a Mars Conjunction Rahu 2/21/21, are we setting ourselves up for a crash wave? The current Active Cycle along with the Mars Rahu conjunction will give us clues and confluence what will happen in the coming days, weeks and months.

Monday, February 22, 2021

You ain't seen nothing yet


The active cycle in Trading Days (instead of Calendar Days) is even more accurate and was looking for a 2/11 major High+/- 3 TD, 2/16H was the High at the very Open so 1 TD and a few minutes off.
Image


The active cycle was looking for a 2/11/21 major High, next we decline into today, see a 2/23 Lower High+/-, decline and another Lower High and decline again. 

If this cycle remains alive, you ain't seen nothing yet.

Wednesday, February 10, 2021

Time is running out


GapsRUs


Markets remain in Blow-off mode, with 5 Up gaps since Feb 1st and 21 Up Gaps since 3/23/20L. This morning will be the 6th higher since Feb 1st.

Tuesday, February 9, 2021

The dominant Active Cycle: February 8-12 2021 major High of the year


This was also based on a dominant "active cycle" that has been in that market in the last year.

For any cycle to be "active and alive", it has to have atleast 3-5 recent hits. The result is that these cycles have an amazing predictive value and accuracy.

From the 1/31 T&C Daily Email: "There are several active cycles that are suggesting we rally into Feb 5-8 and see an Important High"

Ideally, we are seeing this last gasp rally into 2/8 High+/-4 CD, as the dominant active cycle is suggesting. These cycles are rare finds these days, probably due to manipulation.


This active cycle has a variance of +/-4 CD and it currently has 8 hits:

1. 03/23/20L
2. 06/08/20H
3. 09/02/20H
4. 09/24/20L
5. 10/12/20H
6. 10/30/20L
7. 01/04/21L
8. 01/15/21L
9. 02/08/21H

The active cycle is next due: 2/8/21H+/-4 CD, so this could stretch into 2/12 and if this cycle remains correct, this should be the major High of the year.


Join our free forecasts and subscribe at: 

Friday, February 5, 2021

Tuesday, February 2, 2021

Last gasp rally phase?


We have had some wildly volatile couple of weeks recently.

From the 1/29 Raj T&C Update: "The 1/27-28 quadruple time Cluster was a 1/26H and a possible 1/29L today... The 39 TD Cycle in the Emini SP (see chart) suggests a 1/29-2/1L".

Actual: We made a 1/29L in the SPX Cash and 2/1L in the Emini SP futures and have now started a last gasp rally phase.


What's next: From the 1/29L, various proprietary active cycles are expecting a last gasp rally and the coming High could be the High of the Year. 

If these cycles are correct, time is running out as a giant bubble is about to pop. 

As they say, may we live in interesting times.


Join our free forecasts and Updates at: 

Tuesday, January 5, 2021

Intraday Time and Cycles for Jan 5 2021

We need a follow through delcine to confirm the Jan 4 Highs.


The intraday 5 min SPX Time CIT 01/05/20: 10.45, 11.25, 11.50, 1.45, 3.05 pm Eastern

Actual: 10.45L, 11.15L

The intraday cycle sees a 1st hour High, midday High and last hour High

Intraday Cycle are the Pink lines: (9.40L), 10.00H, 11.00L, 12.30H, 2.30L, 3.50H

Actual: 9.30L, 10.05H, 11.15L

Monday, January 4, 2021

January 4 2021 is our next Time and Cycle High


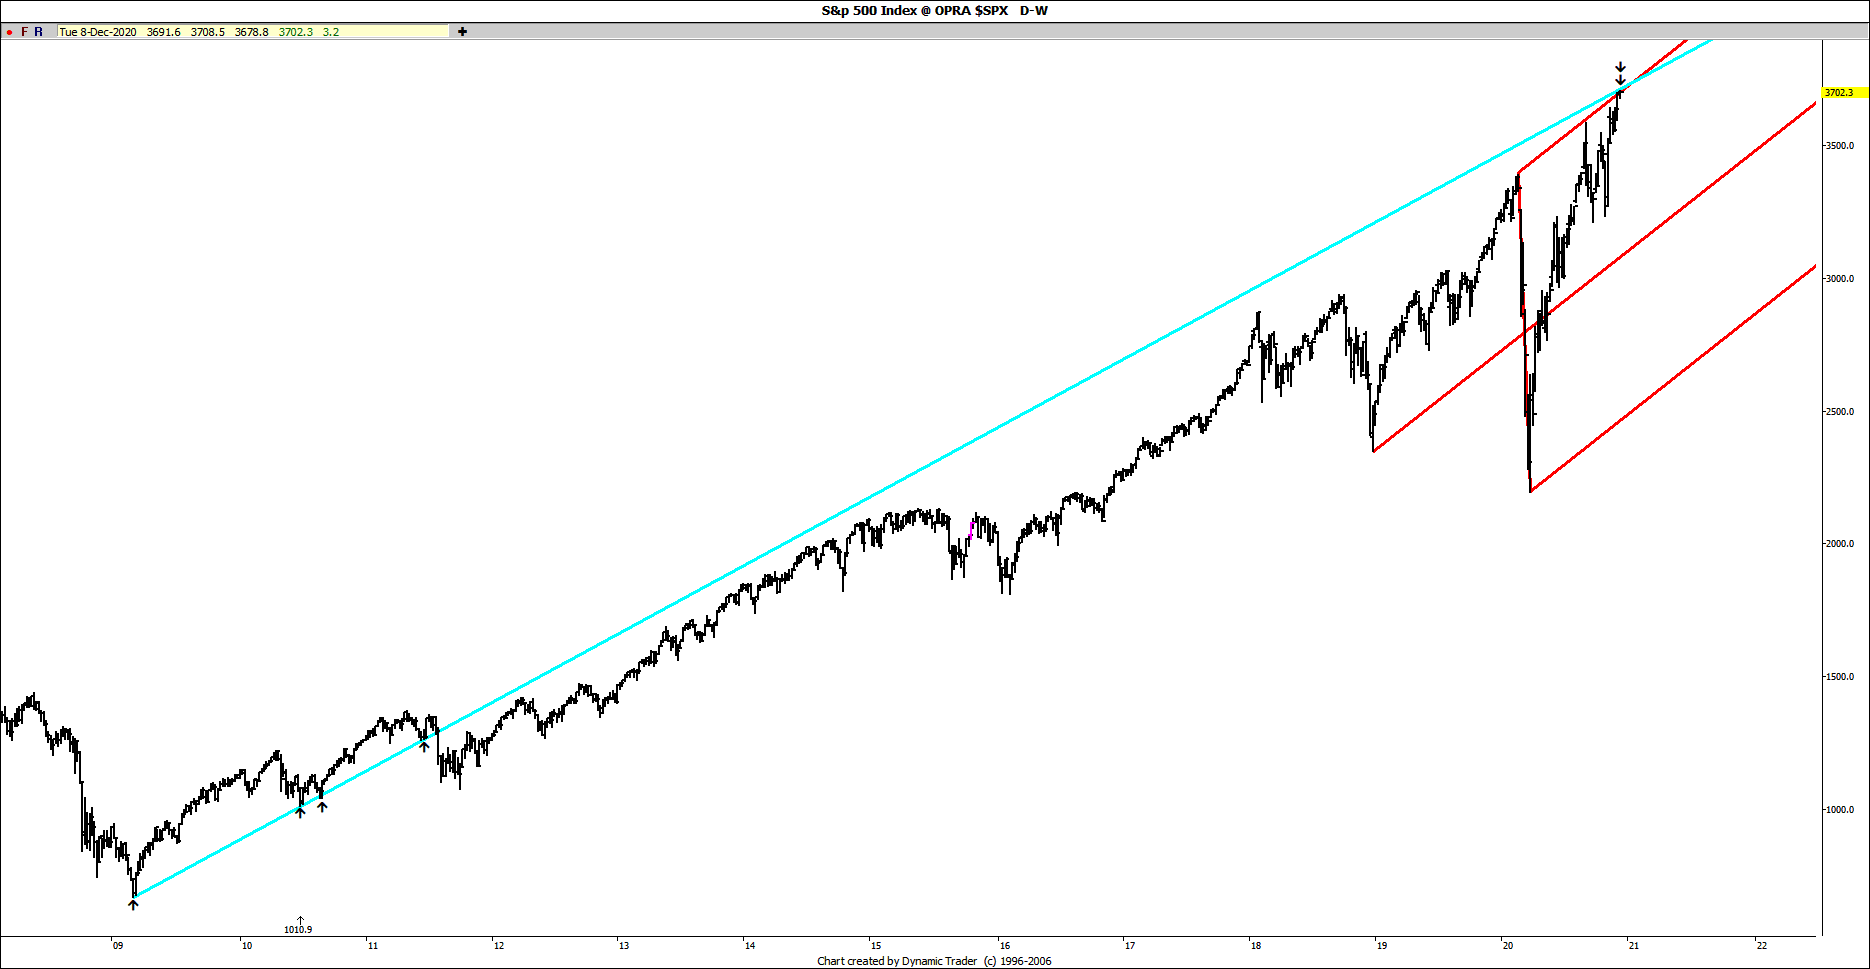
The SPX gapped higher to fresh All time Highs at the opening 9.30 High at 3769.99 SPX today, right at our outstanding 3760-65 SPX Triangle target we had for many weeks, reversed a sharp 107+ SP to a 12.15 Low at 3662.71 SPX and closed lower, down -55.42 at 3700.65 SPX. 

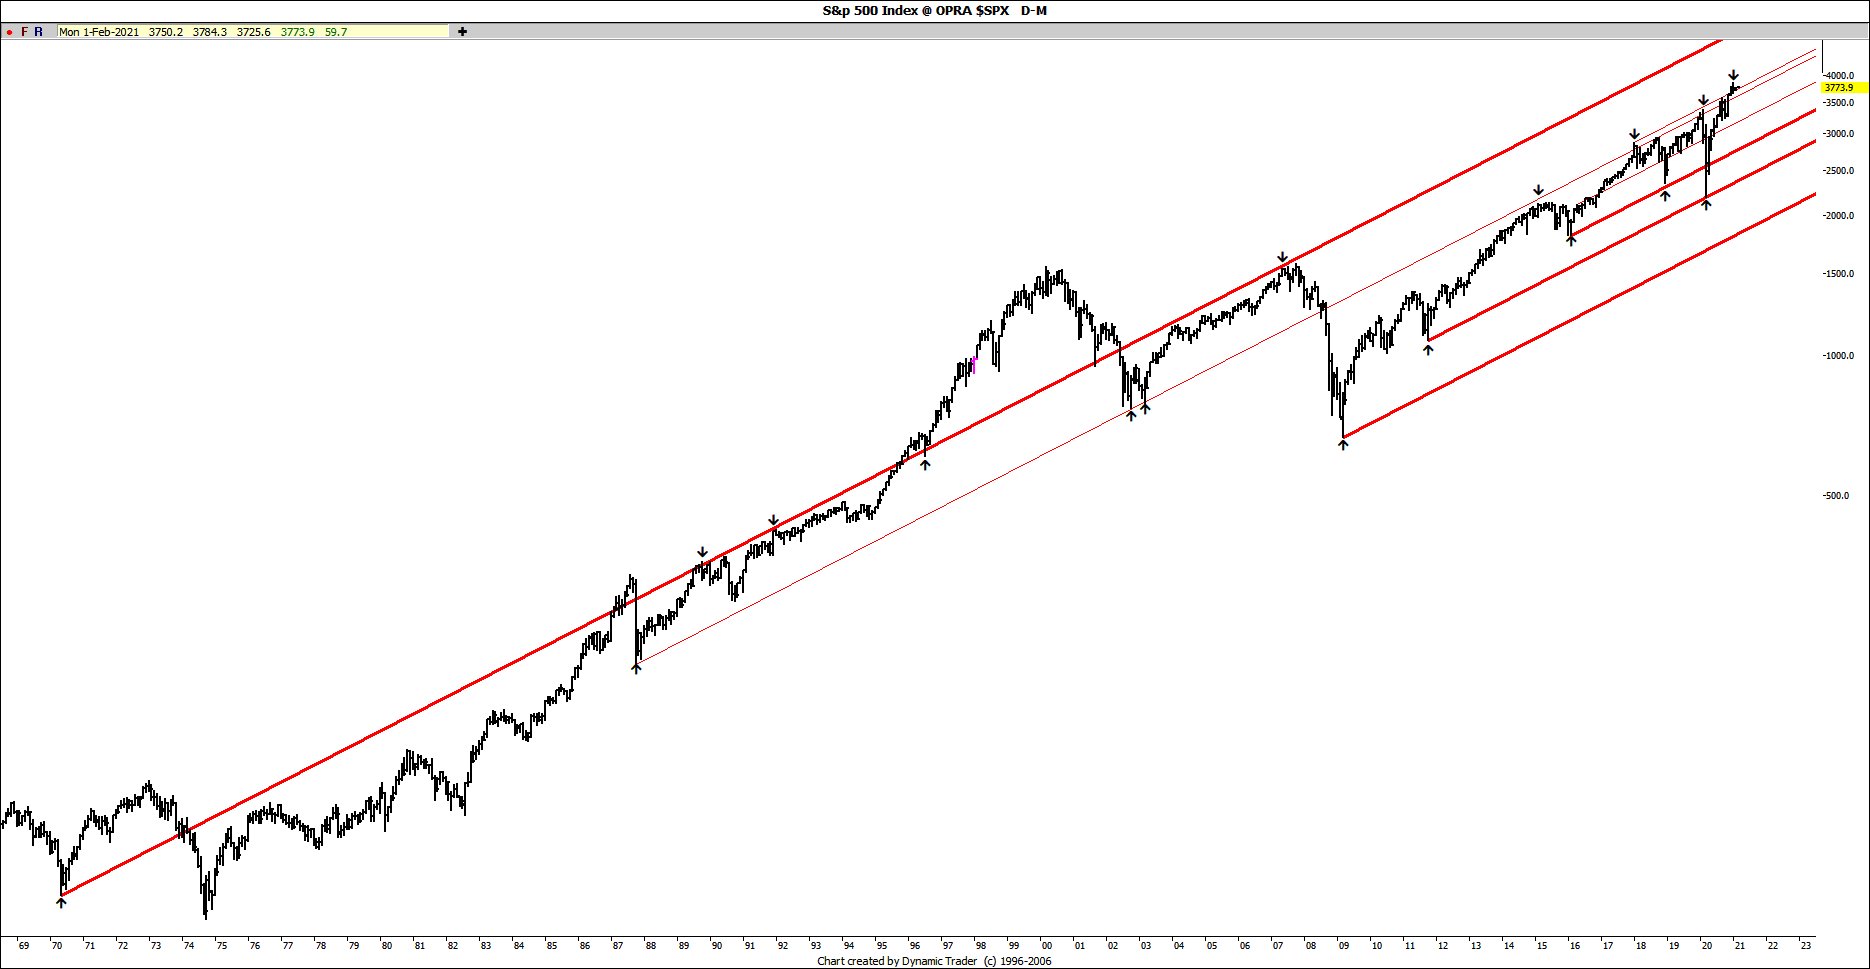
Time CITs: We rallied into the 12/31 Geometric & 1/02 Solar time CIT, suggesting we saw a 1/04/21 High, right at the Open and we saw a sharp intraday reversal and close lower to confirm, closing back below key Fork and LT Trendline resistance at 3730 SPX. 

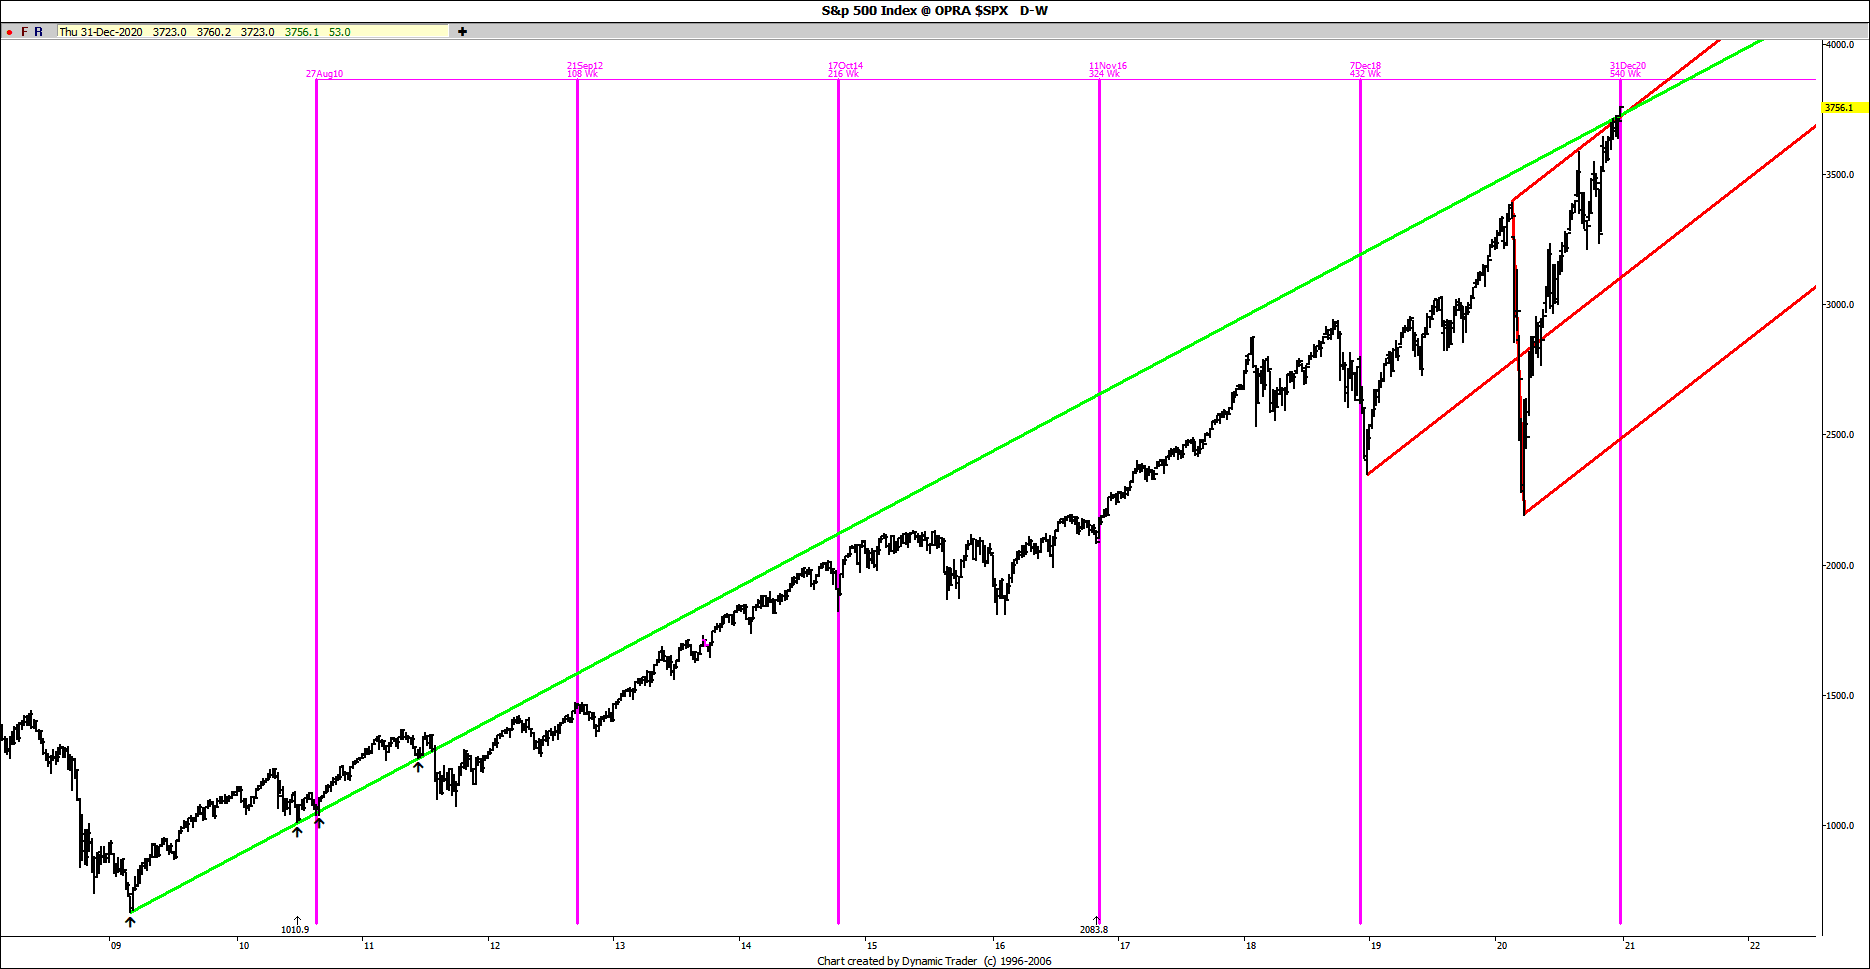
Cycle CIT: The 108 week cycle (see above chart) was due 12/31/20, but has a variance of a few weeks, and may well be today’s 1/04/21H, right at the projected 1/05/21H+/-1.

12/31/20:108 week+/-1 wk Cycle: 8/27/10L - 9/14/12H - 10/15/14L - 11/08/16L – 12/5/18H-2- 12/31/20 +/-1 week. 

What's next: We confirm the 1/04/21 swing High and see a continued decline into the next Time and Cycle cluster.


Covid special Subscription discounts are found here: 


Join

Join our free forecasts and subscribe at: 


Thursday, December 17, 2020

12/17-18 is the next swing High

In our 11/27 public Post, the next T&C Cluster was centered on 11/30 and was biased to be High.

Actual: The 11/30 T&C Cluster inverted to a 11/30 Low.


From 12/10 Raj T&C Daily Email: "The cycle bias is we see a 12/10L and we now rally into 12/17H at the 12/15+/-2 Long term Geometric time CIT and 12/17 Solar time CIT"

Actual: We made a 12/11L and have now rallied into today's 12/17 proprietary 12/17 Solar time CIT, right at long term Trend line and Fork resistance.

Whats' Next: We see a 12/17-18H at the 12/17 Solar and 12/18 double Geometric short term time CIT and start a next decline into XXX T&C Cluster Low.


Join our free forecasts and Updates at: 

Wednesday, December 9, 2020

Friday, November 27, 2020

You are here: 11/30 High

 From the 11/5 Public Blog: “We should make a 11/6-9 swing High, before the next decline. There are 3 more important T&C (Time and Cycles) Clusters remaining in November that should be crucial to watch in the coming weeks.”

From 11/8 Raj T&C weekend Report: “Ideally we see an 11/6-9H at the 11/7 weekend Solar time CIT at the 9 TD cycle and a 47/94 TD Cycle due 11/9H. We then see a brief decline into 11/12-13L”

Actual: We made a 11/9H (#1 on chart) and declined into 11/12L (#2) at the 11/12 double Geometric time CIT.


From 11/15 Raj T&C weekend Report: “We have rallied into 11/15 weekend Geo time CIT suggesting a 11/13-16 short term High…If Globex futures are higher, we should see a 11/16H, with a decline into 11/19L at the 11/19 Geo time CIT”

Actual: From 11/12L, we rallied into 11/16H (#3) and declined into 11/19L (#4).  

From 11/20 Raj T&C Daily Update: “We saw a last hour Low today, so Monday 11/23 Solar time CIT will be a 11/23 Low (#4) and we rally into 11/27-30 T&C Cluster High (#5), which includes a Lunar Eclipse”

Actual: We made a 11/23L (#4) and are now rallying into 11/27-30 High (#5)

What’s Next: We should see a 11/30 swing High and start the next decline.


The 11/30 T&C Cluster includes:

1. 11/27-30 double Geo time CIT 

2. 12/1 Solar time CIT

3. 12/1 is  69 Squared weeks from the 9/3/29H (see table below) 

4. 11/29 is the fibonacci 1618 CD cycle from 10/8/98L 

5. 12/1 is the next 9 TD Cycle


11/29: 4.5 Yrs/1618 CD/231 wk Cycle: 10/8/98L-1616-3/12/03L-1618-8/16/07L-1618-1/20/12L (miss)-1618- 6/25/16L-1618- 11/29/20


9/3/29H +

55 Squared weeks = 08/25/87H

56 Squared weeks = 10/10/89H

57 Squared weeks = 12/10/91

58 Squared weeks = 02/22/94H

59 Squared weeks = 05/21/96H

60 squared weeks = 09/01/98L(-308 = 10/28/97L)

61 squared weeks = 12/26/00H

62 squared weeks = 5/6/03

63 squared weeks = 9/27/05

64 squared weeks = 3/04/08 (+308 = 1/06/09H)

65 squared weeks = 8/24/10L+2

66 squared weeks = 2/26/13L (+308 =12/31/13H)

67 squared weeks = 09/15/15H+2 (+308 = 7/19/16+1H)

68 = 4/17/18H+1

69 = 12/01/2020

9/3/29H+69 Squared weeks = 12/1/20.


We should see a 11/30+/-1 swing High.


Join our free forecasts and Updates at: 

Wednesday, November 18, 2020

US$ Dollar Watch


The US$ Dollar is at critical support levels at 91.75.

US$Dollar time CITs: 11/30, 12/11 & 12/24** is major.