Friday, December 31, 2021

Happy and Prosperous New Year to all


We have been sideways since the 11/5-8/21H, which remains the All time Highs (ATH) in many indices and market leaders like the Russel, Bitcoin, Ethereum, and Tesla. The Dow made marginally fresh ATH on 12/30 and is at a potential double top with the 11/5-8H.


There is a 334 week cycle due 12/24/21 week+/-, although it only has 3 hits so far.

The Master Cycle is now active again and will guide us in 2022.


Happy and Prosperous New Year


Friday, December 24, 2021

Merry Christmas 🎄 🎁 and Happy Holidays to all 🙏🏼

 The market bottomed at the 12/20 T&C Cluster Low at the 12/20 Apple, 12/21 double SPX Time CIT and 10 TD Cycle Lows and we are rallying as expected into the next T&C Cluster.


Merry Christmas 🎄 🎁 and Happy Holidays to all 🙏🏼

Tuesday, December 14, 2021

The amazing Geometric time CITs

We declined almost 100 SP's in the last 2 days, since the 12/10 High. 

It baffles me that these geometric mathematical formulas to find CITs continue to work even today. I frankly don't know why they work, just that they do  70-80% of the time, ie 20-30% don't work.

http://timeandcycles.blogspot.com/2021/12/forecast-1-short-term-1213-swing-high.html


Review 12/13 Intraday Time and Cycles:


(A): " We will see a 12/10-13 High" (see (A) on chart)

""The current bias (but that can change quickly) is 11.00 will be a Low (1), 11.30 will be a High (2) and 1.10-15 pm will be a Low (3). So if we get an opening 9.40H+/-, we decline into 10.20-11.00 Low (Speculative), rally to a 11.30H+/-, decline to a 1.10-15 pm Low. We see a last hour Low (4)"

Actual: Time CITs (Change in Trend) could be Highs or Lows.

11.00 CIT was a 10.55H, 11.30 CIT was a Low, 1.10-15 CIT was a 11.05H.

The intraday cycle suggested a 1st hour Low (1), midday High (2) and last hour Low (4), which we have generally seen.

Monday, December 13, 2021

Intraday Time and Cycle Updates


"The current bias (but that can change quickly) is 11.00 will be a Low, 11.30 will be a High and 1.10-15 pm will be a Low. So if we get an opening 9.40H+/-, we decline into 10.20-11.00 Low (Speculative), rally to a 11.30H+/-, decline to a 1.10-15 pm Low. We see a last hour Low."

11.20 am Update: We got our 9.30H and our expected decline into 11.15 Low so far. The 11.00 CIT (High or Low) was a 10.55H.

Sunday, December 12, 2021

December 10-13 short term High

The following short term forecast is speculative and for Entertainment purposes only, do trade at your own risk.

All trends are Up as we recently bottomed at the 49 Trading Day (TD) Cycle of Lows (see Emini SP chart below), we are generally higher and surprises will be to the upside.


We have rallied into Friday 12/10 SPX proprietary Geometric* time CIT (change in Trend) and into Monday 12/13 Apple Geometric time CIT, suggesting a short term 12/13 swing High is being made. We need a reversal and close lower to confirm a 12/13 swing High is in.

The intraday cycles are suggesting a possible spillover rally Monday in the 1st minutes, before we reverse lower.  

Intraday CIT times to watch, all /-5-10 mins are: 11.00, 11.30 and 1.10-15 pm Eastern.

Speculative Intraday Times and Cycles Bias: The current bias (but that can change quickly) is 11.00 will be a Low, 11.30 will be a High and 1.10-15 pm will be a Low. So if we get an opening 9.40H+/-, we decline into 10.20-11.00 Low (Speculative), rally to a 11.30H+/-, decline to a 1.10-15 pm Low. We see a last hour Low.


Apple, the NDX market leader, made fresh All time Highs and all Apple trends are higher. We are rallying into 12/9 & 12/13 CIT, suggesting a short term 12/10-13 High being madebut we need a reversal and close lower to confirm.


Bitcoin, the bubble leader, remains weak and closed lower Friday, below key pink channel support. We are declining into 12/13 Geometric time CIT, suggesting a short term Low.


* Notes: We use 2 proprietary Time CITs (Change in Trend) that are unique to our Raj T&C Daily Email newsletters.

1. Geometric time CITs are +/-1 Trading Day (TD) and are 70-80% accurate (20-30% will not work). 

If we rally into a Geo time CIT, it suggests a High being made +/-1 trading day (TD).

If we decline into a Geo time CIT, it suggests a Low being made +/-1 trading day (TD).

2. Solar time CITs are +/- 1 TD and are 80-90% accurate (10-20% will not work).


To join our free forecasts, subscribe & follow us at: 


Saturday, December 11, 2021

Free Forecast

The current rally forecast was posted in the evening of 12/7 for subscribers and also the decline and cycle Low that follows it. 

Folks as this is a season of Giving, I will post what our T&C  research suggests is the next Cycle High and Low, if I get 300 likes on this blog and on https://twitter.com/TimeandCycles


Friday, December 10, 2021

Markets and the recent Eclipses

 So far, the Friday 11/19 Lunar Eclipse topped this market on Monday 11/22H and we bottomed on Friday 12/3L at the 12/4 Solar Eclipse.

Sunday, December 5, 2021

Reviewing Time & Cycles and what's next

In my post from 11/8/21, I stated: "We rallied into long term channel resistance at 2720-50 SPX and into the 18 wk and 75 wk Flash Crash cycles due to top out now or in the coming week+/-"

The actual results are as follows: 

  1. The Dow and Russel 2000 made a Nov. 8 all-time high, and the indices have since seen a sharp decline. 
  2. Bitcoin (BTC-USD) and Ethereum (ETH-USD) made a Nov. 10 all-time high, and saw a sharp decline since.
  3. Tesla (TSLA), one of market leaders, made a Nov. 4 all-time high and also declined.
  4. The SPX made a Nov. 5 high and double topped with the Nov 22. all-time high.


The Dow saw a Monday Nov. 8 all-time high and it has since experienced a sharp decline.


The Russel 2000 also saw a Nov. 8 all-time high and it has similarly experienced a decline since then.


Bitcoin, the cryptocurrency leader, saw a Nov. 10 all-time high and saw a sharp decline since.

Ethereum, another crypto leader, also saw a Nov. 10 all-time high, and it has seen a decline as well.

Tesla, one of the market leaders, experienced a Nov. 4 all-time high.


The SPX made a Nov. 5 high and double topped with the Nov. 22 all-time high at the 4743.80 level. This was seen at the 66-week cycle, the 266-CD, and the 56-CD cycle. It experienced a sharp decline following this point in time. 


What's Next?

A few weeks ago, we were looking for a Nov. 22 high and a decline into the next 'Time and Cycle Cluster Low,' which appears to still be in progress.


To join our free forecasts, subscribe & follow us at: 


Wednesday, November 10, 2021

3/23/20L Trendline was key resistance in the Russel, Tesla and Bitcoin


3/23/20L Trendline was key resistance in the Russel, Tesla and Bitcoin,

something to watch closely

Monday, November 8, 2021

Long term 18 and 75 Flash Crash week time Cycles are clustering right now at Price channel resistance


SPX Markets are at long term channel resistance


The 75 week Flash Crash cycle is due 11/5 wk+/


The 18 wk Cycle is ¼ cycle of the dominant 72 (& 144) wk cycle and is due 11/5 wk+/-


The Russel 2000 is at long term Trendline resistance


Conclusion: We rallied into long term channel resistance at 2720-50 SPX and into the 18 wk and 75 wk Flash Crash cycles due to top out now or in the coming week+/-.


To join our free forecasts, subscribe or follow us at: 


Thursday, October 14, 2021

Crash Cycles?

 The 9 days of Mother Divine (MD) was on 10/6-15.

The MD Crash Cycle, IF active, suggests a secondary 10/15H and a crash wave into the NM–2 = 11/3L.

The Flash Crash 75 week cycle, if active suggests a crash Low due 11/5L.


Here is some more info on the crash History of the 9 Days of Mother Divine http://timeandcycles.blogspot.com/2008/04/crash-history-of-9-days-of-mother.html

Here is some more info on the Flash Crash 75 week cycle: http://timeandcycles.blogspot.com/2013/04/the-flash-crash-cycle.html


The NDX Master Cycle (MC) gets precedent above all other cycles. It recently predicted an 10/11L(+1) and the rally into 10/15H+/-. The MC has its own unique path,which I will update this weekend for members.

Tuesday, October 5, 2021

SPX at MOB double channel support


SPX is at MOB (Make or Break) double channel support at the 10/4L.
(1 day after the projected short term 10/1L).

Below this double channel support opens the door to much lower prices.


Next Time CIT (Change in Trend) to watch 10/6-7:

10/6 Geometric
10/5-7 Bitcoin
10/6 Pluto Direct 
10/6 start 9 days of MD 

10/7-8 Midpoint MeR&D

Plenty of volatility directly ahead.


To join our free forecasts, subscribe or follow us at: 


Friday, October 1, 2021

Review Raj T&C forecasts and what is next: 9/30-10/1 swing Low

Forecast 1:  From 9/17 Raj T&C weekend report: "We declined into a T&C Cluster and right at the 21 TD Cycle of Lows due 9/17L+/-1, suggesting a 9/17-20L, then rally into 9/26-27 Solar and Geo time CIT."

Actual: We made a 9/20L and rallied 160+ SP's into 9/24 swing High, at the 9/26 weekend (9/24-27) Solar & 1 day before the 9/27 Geometric time CIT.


Forecast 2: From the 9/25 Raj T&C weekend report: "From the 9/24H, we decline into 9/30-10/1L at the 9/30 Geo and 10/3 Solar weekend CIT"

Actual: From the 9/24H, we have declined 160 SP's into 9/30-10/1 as expected and should now see a rally next week.


Friday, September 17, 2021

You are here


You are here: will channel support hold?

Friday, September 10, 2021

Apple following the Master Cycle (MC) Map


Apple
, the NDX market leader, is following the Master Cycle (MC) Map to a T as it
 is sharply lower on today's adverse judge rulingThe NDX Master Cycle suggested a 9/7-8H+/- and a sharp retrace into 9/10 swing Low at NDX & Apple's 9/10 time CITIt has been in a red channel since early July, which is in a larger grey channel. Apple CITs are: 9/10, 9/15. 

Similarly, NDX and Bitcoin (see previous post) is declining into Bitcoin's 9/9-10 proprietary triple Geo Time CIT, suggesting a Time and Cycles swing Low being made.

Wednesday, September 8, 2021

Bitcoin's chart & Market outlook

In our 8/24-26 Blog posts, 2 weeks ago, I posted a Bitcoin chart, which has been updated below, and asked what we can read from the chart.


Here is a little what we read from the above chart:

1. The 3/13/20 red Trendline acted as Key resistance at the recent 9/6/21 swing High, the 70.7% retrace.

2. The other trendline will act as Trendline support around 39485, close to the 55% retrace.

3. The pink vertical lines are proprietary Geometric Time CITs (Change in Trend = High or Low) and we are declining into 9/9-10 triple Geometric Time Cluster, suggesting a 9/10 swing Low.

4. The 68 TD Cycle last saw the 1/8/21 High, 4/14/21 High and 7/20/21 swing Low is next looking for an 10/21 High or Low, right at the 10/22 Geo Time CIT.


5. The proprietary NDX Master Cycle remains active. It recently projected a 9/7-8H and we saw a 9/7 NDX High and is now looking for a sharp decline into 9/10 swing Low, supporting the above Bitcoin outlook.


To join our free forecasts, subscribe or follow us at: 


Thursday, August 26, 2021

Bitcoin


This is a Bitcoin Log daily chart, what can we say about this chart? 
Where is key trendline resistance and support? Is it Bullish? Bearish? What does the fixed 68 TD cycle on the chart suggest? What does the green wedge Trendlines suggest? The Pink lines are potential Change in Trend (CIT) dates, the last one saw an 8/23H.

Tuesday, August 24, 2021

The Master Cycle (MC) and longer term charts

The MC (Master Cycle) from the 8/11-13H, projected the decline into 8/19L+/-0 and its subsequent rally. The long term monthly SPX suggests limited upside.

The weekly SPX is in a long term rising wedge.


The Daily SPX closed right at rising wedge Trendline resistance, since March- April 2021.


Bitcoin retraced 61% so far and closed right at long term TL resistance. It has Geo Time CITs at 8/25. Let us watch the major triple time Cluster on 9/9-10***

What's next: The MC projected the recent 8/19L and the current rally into the next cycle High.

Wednesday, August 18, 2021

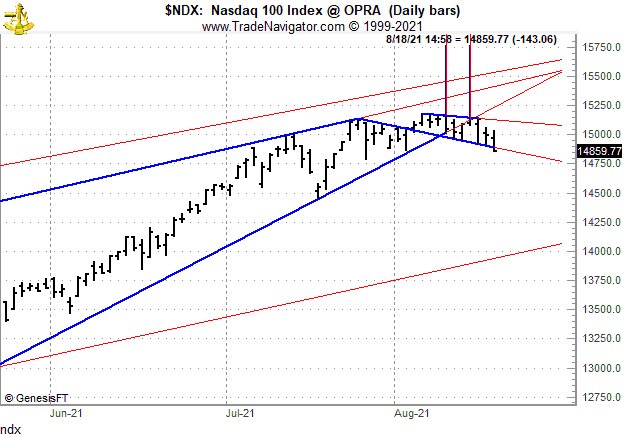
Boom


Replying to
Boom, cracking key support
Image