Thursday, October 3, 2013

We are close to a Major Low

http://www.safehaven.com/article/31335/we-are-close-to-a-major-low

From my last 9/17 public blog post:”We should rally into a 9/18 Solar CIT High+/-1 and see a decline into the next Time and Cycle cluster Low”

Two forecasts were made in the last few weeks:

Forecast 1: From the 9/18 Daily Email: “We are extremely overbought and we should see a solid 30-50 SP pullback into the 9/24 T&C Cluster CIT Low.”

Actual: The 9/18 Solar time CIT (Change in Trend) was the 9/19 High near the open (Point “A” on the chart below) Swing traders were told to short and keep the stop at the 9/19 High, we then declined 42.25 SP’s into 9/25 Lows (Point “B” on the chart). Here were the various reasons for the 9/19H and 9/25L:

1. The 9/18 Solar CIT was the 9/19 High near the Open.
2. There was a 9/23 Long term CIT, which was the 9/19H, 2 TD earlier.
3. The 472-75 CD Cycle was the 9/19/13H:
7/15/08L-475-11/2/09L-473-2/18/11H-472-6/4/12L-472-9/19/13H.
4. The 186 TD Cycle arrived at the 9/19H as well.
5. The 9/24 geometric Time CIT was the 9/25 Low.


Forecast 2: From the 9/27 Daily Email: “There is one Bear Cycle that suggests a 9/26 High, then sharply lower into 10/4-7 Lows. The markets are getting spooked by another Government shutdown by 10/1/13 and could see a sharper sell-off. The ideal target for this decline is the Make or Break 11/16/12L – 6/24/13L Uptrend channel at 1665 SPX or the 1657 SPX H&S Target”

From the 9/28-30 Weekend Email: “There is an 10/1-2 Time CIT, even though the Bear cycle above says nothing about the 10/1-2 Time CIT date, the bias is we make a 9/30 lower Low and see a sharp rally into an 10/1-2 High, before we turn south once again into 10/4-7 Lows. The SP Cycle has an 10/1 CIT. The 23 TD cycle is next due on 10/1. There is a 10/1 geometric and 10/2 Solar CIT”

Actual: The markets saw the 9/26 High at 1703.85 SPX (Point “C” on chart above), which was the 9/25 Solar time CIT High and where subscribers went short. We saw a sharp 29 SP decline into the 9/30 Low (Point “D”), saw a brief sharp 22 SP rally into 10/1 High at the close (Point “E”). The SP Cycle 10/1 CIT, The 23 TD cycle on 10/1, the 10/1 geometric and the 10/2 Solar CIT were all the 10/1 High. We then reversed lower into today, declining 30+ SP’s from the 9/26H so far. Despite the shutdown news driven market, the Bear cycle that saw the 9/26 High and then sharp decline into 10/5 Lows has been accurate so far and highly profitable for our swing traders who went short at the 9/26 Highs.


What’s next?: We should continue to decline and make an 10/4-7 major Low. I don’t have any high quality Time CITs supporting this Cycle CIT Low date, but the next Solar Time CIT on 10/9 should be another Low. In general, it is the Bulls turn to stampede higher into my next proprietary Time and Cycle cluster CIT. 

This is my last public post for quite some time as the coming weeks should be a wonder to behold.

Tuesday, September 17, 2013

Review and longer term outlook

http://www.safehaven.com/article/31142/times-and-cycles-review-and-longer-term-outlook

Review: In my 9/10 blog post, http://timeandcycles.blogspot.com/2013/09/review-and-forecast.html, I was looking for a 9/11H, brief pullback into 9/13L and another rally into 9/18H.  It was also mentioned then that a rally above 1692 SPX would lead to a retest of the 8/2 all time Highs.


Actual: We rallied into a 9/11-12 Solar Change in trend (CIT) High, saw a brief pullback into 9/12-13 geometric CIT Low and continued to rally into today, retesting the 8/2 All time Highs at 1709.67 SPX.


Longer term: We made a 35 month cycle Low at the 6/24/13 Low at 1560.33 SPX and have rallied above the 3/24/00H at 1552.87 SPX and 10/11/07H at 1576.09 SPX and trend line, which currently is at 1596 SPX. The markets are bullish above 1560-1575 SPX Make or Break support area and bearish below it.

What’s next shorter term: We should rally into a 9/18 Solar CIT High+/-1 and see a decline into the next Time and Cycle cluster Low.


9/20 Update: 9/18 Solar CIT was the 9/19 High right at the Open High of the Day.
We are now down into my next T&C Cluster CIT. Swing traders that went short at the 9/18-19 High, should be in profits now. Keep your stops tight at the 9/19H.

Tuesday, September 10, 2013

Time and Cycles Review and Forecast

http://www.safehaven.com/article/31061/times-and-cycles-review-and-forecast

In my last blog post, I was looking for a decline into 8/16-19 CIT (change in trend), which was a miss as we declined beyond that date.

Forecast from the 8/29 Daily Email (2 weeks ago): "The 8/23-24 Solar time Change in trend (CIT) became a Monday 8/26H. Shorter Term: We decline into 8/28-30 Solar CIT Low, then rally into 9/5 or 9/11 Solar Time CIT lower Highs.

Actual: The 8/29 Solar time CIT was the 8/28 Low. The 9/5 Solar and Geometric time CIT was the 9/6 Low and we are now rallying into the 9/11 Solar time CIT. The proprietary Solar Time CIts continue to be highly accurate.


There was also an 8/29-9/2 Time and Cycle (T&C) CIT Cluster.

Time Squares from 7/18/06 major Low have a long history of accuracy:
7/18/06L + 50 Squared Days = 5/22/13H
7/18/06L + 51 Squared Days = 8/31/13 => 8/28/13L.

Time Squares from 4/26/10 major High also had plenty of hits.
4/26/10H + 33 Squared Days = 04/19/13L
4/26/10H + 34 Squared Days = 06/25/13L
4/26/10H + 35 Squared Days = 09/02/13 => 8/28-30L.

Furthermore, we had a 55 week, 89 TD Cycle, 23 & 45 TD Cycle that became the 8/28/13 Low, which was right at the 11/16/12L- 6/24/13L trend line and down channel support.

What’s next: We broke above the daily down channel and 8/26 last swing High, which is bullish. We should now rally into the 9/11 Solar time CIT, decline into the 9/13 geometric time CIT and rally into the 9/18 Solar CIT and make a lower or higher High. Make or break resistance above is at 1692 SPX, which is both the 78.6% retrace and Trapdoor resistance. A rally above that will lead to a retest of the 8/2 all time Highs.

Thursday, August 15, 2013

The next Time and Cycles (T&C) Cluster is on August 16-19 Low of the Month

http://www.safehaven.com/article/30802/the-next-time-and-cycles-tc-cluster-is-on-august-16-19-low-of-the-month

In my last blog post, I was looking for an 8/2 High and then "a decline into my next Time and Cycle (T&C) Cluster Change in Trend (CIT) and make a major Low of the Month."


Forecast: From 14 days ago, in the 8/3 Raj T&C Weekend Email: "We should rally into 8/2-5 major Highs, then decline into August 16 Time and Cycle Cluster Lows, targeting at least 1650 SPX+/-"

Actual: 8/2 High, decline into 8/15 Low at 1658.59 SPX so far


What's Next: We should continue to decline into an 8/16-19 T&C Cluster Low of the month. 
Time CIT: 8/17 is the next proprietary Solar Time CIT that should be a 8/16-19 Low. There was an 8/15 Long term proprietary geometric Time CIT due on 8/15, that is +/-2-3 TD as it covers decades.  There was also a shorter term geometric 8/15 Time CIT.
Cycle CIT: The last four 45 TD Cycles has been averaging 38-39 TD (see chart) , targeting August 16-19 major Low of the Month.
The intraday cycles Friday (and Monday) supports a decline with a 1st hour low and bias to be lower.

Wednesday, August 7, 2013

Time and Cycles Review and Forecast

http://www.safehaven.com/article/30719/time-and-cycles-review-and-forecast

In my 7/27 blog post, I had a 7/26-29 Time and Cycles (T&C) Cluster Change in Trend (CIT), which became the 7/26 Low.

From my 7/27 T&C weekend Email: "Short Term: 7/26-29L, rally into 8/2-5 Highs".


Actual: We made a 7/26 Low and rallied into Friday 8/2 High at 1709.67 SPX, which was the 8/5 Solar CIT High and right into triple trend line resistance. The 4/26/10H-5/2/11H major trend line held back the recent 5/22/13 rally High and more recently the 8/2/13 All time Highs.

What's next: We should now decline into my next T&C Cluster CIT and make a major Low of the Month.

7/8 Update: First we make a secondary High first.

Saturday, July 27, 2013

The next Time and Cycle cluster


The next Time and Cycle Cluster Change in Trend (CIT) is on 7/26-29.
  1. Friday 7/26 is the next Medium Term Geometric Time CIT.
  2. Monday 7/29 is the next Solar Time CIT. Solar CITs have an 84-90% accuracy. The 7/17 Solar CIT was the 7/16-17L, the 7/23 Solar CIT was the 7/23 High. The next Solar CIT is on Monday 7/29+/-1
  3. Calendar Days to Trading Days CIT relationship in the market:
    10/4/11L: + 52 CD = 11/25/11L, + 53 TD = 12/19/11L
    +181 CD = 04/02/12H, +182 TD = 06/25/12L
    +241 CD = 06/01/12L, + 239 TD = 09/14/12H
    +346 CD = 09/14/12H, +345 TD = 02/20/12H
    +409 CD = 11/16/12L, + 409 TD = 05/22/13H
    +454 CD = 12/31/12L, + 454 TD = 07/26/13
  4. The 23 & 72 TD fixed cycles (see chart above) are due on 7/26-29.
Conclusion: The markets should see the next important Change in Trend on 7/26-29.

Thursday, July 11, 2013

Review & Forecast

http://www.safehaven.com/article/30461/review-and-forecast-the-last-few-weeks

Review of the last few weeks and forecast.

1. Forecast made on 6/22/13 Swing cycle weekend Summary: 6/21L, higher into 6/27H, 7/3L


Actual: Monday 6/24 Low, 6/27 High, chop into 7/3 Low


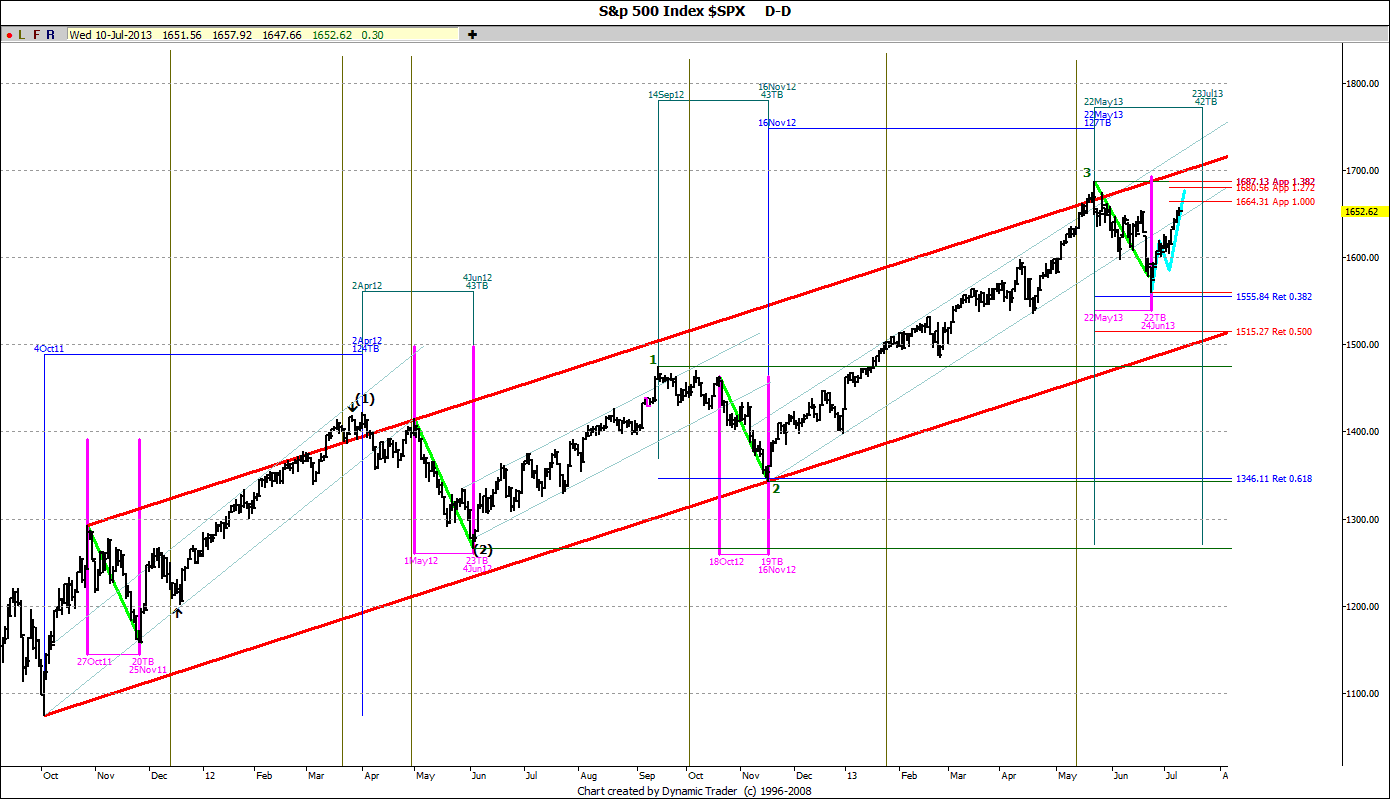
All intermediate declines since the October 4 2011 Low has been mostly averaging 20 TD and at times 43 TD and 131-156 SP’s and 9-11% declines (see chart).  From the 5/22/13 High, we have seen a 126.85 SP/8% decline in 22 TD into 6/24L. This was one of the reasons we expected the 6/21-24 Low.

2. Forecast made on 7/1/13 Swing cycle Summary: 7/3-5L, rally into 7/12 Medium term Geometric and Solar CIT.

Actual: 7/3 Low, rally into 7/11 High so far.


What's next:
Markets unfolded pretty much as expected. We had an A=C = 1664.30 SPX target, which has now been exceeded. We should see a rally into the 1st Medium term CIT due on 7/12, which is also a Solar CIT. Once the High is in, we  should see some pullback, then we should see higher Highs into the 2nd Medium term geometric CI
T.

Sunday, July 7, 2013

SPX, Interest Rates, Gold, Dollar & Crude Oil


The weekly SPX touched long term (red) channel resistance at the 5/22/13 All time High. The rallies since the 3/6/09 Low has been 44-50 weeks long, the most recent one was 50 weeks long from the 6/4/12L to the 5/22/13H. We rallied right into double channel & Down trend line resistance, suggesting a pullback is due. A break above this resistance is bullish short term. The 10/4/11L-6/4/12L (cyan) Up channel support is at 1500-25 SPX in the coming weeks and should be important support in any market decline in the coming weeks. Any solid decline and close below 1500 SPX is confirmed bearish.

7/11 Addendum:  


Review of the last few weeks: Markets unfolded pretty much as expected:

1. Forecast 6/24/13 in swing cycle Summary: 6/21L, higher into 6/27H, 7/3L
Actual: Monday 6/24 Low, 6/27 High, chop into 7/3 Low

2. Forecast 7/1/13 Swing cycle Summary: 7/3-5L, rally into Medium term Geometric and Solar CIT
Actual: 7/3 Low, rally ever since


The weekly Bond markets Interest Rates made a regular long term 93 week cycle major Low (and Bond High) at the 7/25/12 Low at 24.52, piercing below the double bottom at 25.10-25.19 and have rallied ever since.  The next 93 wk cycle is due in April 2014. We rallied to the 7/5 High of the week at 36.77, which is bullish for IR and bearish for Bonds. 


We are rallying into the 508 TD Bond Cycle due around July 8 2013, close to the 7/12 Time CIT (change in Trend) suggesting a short term High is due.  Daily Time CITs: 7/12, 7/22, 8/27, 10/4, 10/21


The Gold Index Daily closed lower last week at 93.50 and remains in the steep bear market. This market should retest 67.42 the 10/08 Lows. The break down in Gold stocks was further confirmed when we took out the 5/16/12L at 164.72. Medium Term Gold Index CITs: 9/12, 11/19


The Gold weekly chart closed sharply lower last week at 1212.70 and has retraced about 55% of the 11/08L-911H.  The trend was confirmed Lower, when we closed below Long term Make or Break (MOB) support, the June 2005 and Nov 2008 Up trend Line, this will become resistance at 1418. The 618% retrace support is at 1153.50.  There is a 162 week Cycle due 9/6/13 week. There is a 124 week Cycle due 11/15/13 week. Gold weekly CIT: 10/18/13 week

Dollar Daily Index
There is normally an Inverse relationship between the stock markets and the US Dollar. If the dollar sees a strong rally, the stock market declines and vice versa.

The Dollar 220 TD (Green) Cycle was the 6/13/13 Low.  It closed higher last week at 84.71, after making a 6/13 Low, closing above the double Top on 5/23/13H at 84.59, with the 7/24/12H at 84.16, which is bullish.


The Long term monthly dollar chart has been in a large sideways triangle since the Dec 2005 Highs and has resistance at 86.50.   Monthly CITs: August & November 2013.


The weekly Crude Oil is bullish as it closed near its highs last week at 103.22, right on the larger long term Triangle since the 5/2/11 Highs, just over 2 years now, with resistance at 103.00 and support at 84.37. Whichever way it breaks will determine the next major direction. There is a 153 week cycle due August 9 2013. There is a long term 61 month cycle of Lows due in March 2014 Lows.

Thursday, June 20, 2013

Review & Forecast: July Crash?

http://www.safehaven.com/article/30219/review-and-forecast-july-crash

From last week's 6/14 Email: "The active Master Cycle (MC) suggests a 6/13 major Low and rally to 6/17 Highs. We should then see a volatile chop into 6/20L”

Actual: We made a 6/13 Low and rallied to a 6/18 High of the week and declined sharply into 6/20 Lower Lows.

From the 6/18 evening email and 6/19 Fed day early morning update:
“I have  several reasons to believe we may be at a short term High today, including the bearish rising wedge and the pattern of Fed Highs in 2013 and see a brief, possibly sharp, pullback into 6/20 Lows.”

The last 3 FED meetings in 2013 were all short term Highs (yellow vertical lines in the hourly chart): 


1. 2/20 Fed announcement => 2/19/13 High
2. 4/10 Fed announcement => 4/11/13 High
3. 5/22 Fed announcement => 5/22/13 High
4. 6/19 Fed announcement => 6/18/13 High

Actual:  We made a 6/18 Fed High, 6/19 went sideways until 2.00 pm High of day and saw a sharp decline into 6/20 Lows. The pattern of Fed Highs in 2013 and the rising bearish wedge were among the reasons we called for a 6/19 Fed High and a sharp decline afterwards, although today's Lows wasn't expected to take out the projected 6/6 and 6/13 major Lows,  so the last blog post suggesting that 6/13 was a major Low, was incorrect, 6/13 was a Low, but not the Low. I was expecting one last Higher High above the 5/22/13 Highs, before the actual decline began, but as the 6/6 and 6/13 Lows have now been violated, it suggests that the more bearish Scenarios are already in play and the coming MC High could be a lower High.

What’s next: We should decline into the 6/20-21 Master Cycle Low right at the 6/21 Solar and geometric double Time CIT and see a sharp rally afterwards.  As mentioned before, I have 2 Medium Term Time CITs (which is rare) due in July 2013 that bears watching. There is one cycle that suggests a potential Crash or sharp decline in July 2013, but let’s see what kind of Highs we get first.

Thursday, June 13, 2013

We are at a major Low

http://www.safehaven.com/article/30141/we-are-at-a-major-low

In my 6/6 post, I had a Time and Cycle Cluster Low due around 6/11/13 +/-.

"There is a proprietary Astrological "passover" CIT suggesting we bottom as early as 6/6-7, but other cycles continue to decline into the 6/11 major Time and Cycles Cluster Low."
http://timeandcycles.blogspot.com/2013/06/the-next-major-time-and-cycle-cluster.html

Actual: We made a 6/6 Major Low at the Passover major CIT and saw a retest of those Lows at today's 6/13 Low. 

The 140 TD Cycle was due 6/11 +/- and should bottom this week.

In the 5/19 blog post, the dominant Time and Cycles were explained.
http://timeandcycles.blogspot.com/2013/05/the-dominant-time-and-cycles.html

Normal fixed cycles versus active Master Cycles.
Normal fixed Cycles expand and contract and is always +/- few weeks or months. Over time, I have found that for some reason, some historic cycles repeat day by day and this cycle is active for many weeks and sometimes many months, until they stop working and disappear. I have named these kind of cycles the Master Cycles, because they follow a certain numerology that can be found in the Bible as well as in Ved.  With any of the Master Cycle and other cycles that are considered "active", all predicted Highs and Lows are often exact or at most +/- 1 TD.  The main rule that I use is the Master Cycle is active as long as the predicted swing Highs and Lows are either exact or +/-1 TD and it is not considered active, ie it will be incorrect, if it exceeds this 1 TD variance of predicted Highs and Lows. The benefit is you will know right away if the cycle is incorrect within 1 trading day. If the Cycle is not “active” anymore, it becomes “dormant” and it should not be used for future predictions. Both fixed and Master cycles should be used, but normal fixed cycles, does not have the active Master Cycle’s accuracy.

There is now an active Master Cycle  that has been generally in the market, as it called the 10/18/12H and 11/16/12L. It became more active just recently when it became a day by day event, forecasting the:

4/18/13L, 5/22/13H, 6/6/13L, the sharp bounce into 6/10/13H and now calls for a 6/13/13 Major Low+/-1.

This Low is in sync with the 35 Month, 140 TD, 37 TD, 11 wk, 22 wk and 77 week cycles all bottoming this week.


This morning we touched the major Up channel support since the 11/16/12 Low

Bottom line: 6/13/13 should be a major Low and we see a sharp reversal higher.

Thursday, June 6, 2013

The next major Time and Cycle Cluster

http://www.safehaven.com/article/30066/the-next-major-time-and-cycle-cluster

Review of the various Time and Cycles of the last 3 weeks, from my last blog post on 5/19/13: http://timeandcycles.blogspot.com/2013/05/the-dominant-time-and-cycles.html:  
”There is a 5/20 geometric and 5/21 Solar CIT that should most likely result in a 5/20-21 High.”

From the 5/17/13 Raj T&C Daily Email’s Forecast: “There is a 5/20 geometric and 5/21 Solar CIT suggesting a 5/20-21 High. From there we see a pullback into 5/23-24L, which is the 5/23 geometric CIT and 5/25 Lunar Eclipse and should be the next 10 TD Hurst Lows. We then see another rally into 5/31H, at the 6/1 Solar CIT and see a sharp decline into 6/11 Cycle Lows”


Actual: We rallied into a 5/22 major High in the 1st hour, which was the 5/21 Solar CIT projected High, declined into a 5/23-24 geometric CIT Low as expected, rallied and formed a triangle 5/30 High, 1 day before the projected 5/31H and have since declined sharply into today’s Lows.

What’s next: There is a proprietary Astrological "passover" CIT suggesting we bottom as early as 6/6-7, but other cycles continue to decline into the 6/11 major Time and Cycles Cluster Low.

Time CIT: 6/11 is both a geometric and Solar CIT.

Cycle CIT: We have the 140 TD, 37 TD, 11 wk, 22 wk, 77 wk fixed cycles all due on 6/11L+/-


140 TD/204 CD Cycle: 2/5/10L (50 Yr), 8/27/10L, 3/18/11L(-2), 10/6/11L(-2), 4/27/12H(+2), 11/16/12L, 6/11/13 +/-

37 TD Cycle (blue): 3/27/12H -5/18/12L -7/12/12L -9/04/12L-10/26/12L -12/20/12H-12/13/12H-4/10/13H- 6/4/12H

37 TD Cycle (Red): 12/31/12L - 2/26/13L – 4/18/13L – 6/11/13L

11 & 22 wk Cycle: next due 6/11/13+/-


77 wk Cycle: 1/6/09H – 7/1/10L – 12/19/11L – 6/11/13+/-

Conclusion: We should bottom in the next 2-4 Trading days, ideally at the 6/11 major Time and Cycles Cluster Low. 

6/7 Addendum:  
"There is a proprietary Astrological "passover" CIT suggesting we bottom as early as 6/6-7"
 
This is the same astrological passover that found the 10/20/87L, 4/4/94L and more recently the 10/4/11L to name a few.  It looks like that Low came at 6/6/13 Low and 6/10-11 is a higher Low.


From 6/6 intraday Update: "Channel support is at 1600-03 SPX for today. Markets are getting oversold, so a bounce/rally is possible and then another retest of the Lows by 6/11 major Lows."

Actual: We bottomed right at channel support at 1598.30 SPX and rallied 45 SP's into 6/10H and have retested the 6/6 Lows at the 6/13 Lows.


Sunday, May 19, 2013

The dominant Time and Cycles

Precise timing is everything in the stock markets. For that reason over the last 2 decades, I had to discard many, many timing techniques that didn’t meet the criteria of finding a major High or Low exact to the day or at most within 1 TD.  Over time, in the last 25 years, I have found 2 proprietary timing techniques that have been consistent in pinpointing future Change in Trends (CIT), ie Highs and Lows within 1 TD. One is a geometric, mathematical timing CITs that are 70-80% accurate and the other is a Solar timing CIT that is close to 84-90% accurate.

Examples of some long term CITs was the June 4 2012 major Low and the September 14 2012 major High. A medium Term CIT was on 4/19/13, which became the 4/18 major Low. I had a rare 3 long term geometric SPX CITs, covering Decades, all clustering on one date, Friday 6/1/12, which became Monday 6/4/12 major Low at the Open. This was predicted since February 2012 in the annual 2012 forecast report. http://timeandcycles.blogspot.com/2012/06/long-term-timing-points.html

Normal fixed cycles versus active Master Cycles.
Normal fixed Cycles expand and contract and is always +/- few weeks or months. Over time, I have found that for some reason, some historic cycles repeat day by day and this cycle is active for many weeks and sometimes many months, until they stop working and disappear. I have named these kind of cycles the Master Cycles, because they follow a certain numerology that can be found in the Bible as well as in Ved.  With any of the Master Cycle and other cycles that are considered "active", all predicted Highs and Lows are often exact or at most +/- 1 TD.  The main rule that I use is the Master Cycle is active as long as the predicted swing Highs and Lows are either exact or +/-1 TD and it is not considered active, ie it will be incorrect, if it exceeds this 1 TD variance of predicted Highs and Lows. The benefit is you will know right away if the cycle is incorrect within 1 trading day. If the Cycle is not “active” anymore, it becomes “dormant” and it should not be used for future predictions. Both fixed and Master cycles should be used, but normal fixed cycles, does not have the active Master Cycle’s accuracy.

Time & Cycle CIT Order of importance: In my work, I consider the active Master Cycle’s Highs and Lows (CITs) as most important as they are +/-1 TD, followed by Solar Time CITs, then Geometric Time CIT, which are the most reliable Time CITs. All other time CITs, like squares, astros, numerology, etc. are only used to confirm the active Master cycles and the two dominant Time CITs. When both Time and active cycles support each other, it increases the accuracy to 90-95% of finding a CIT, a High or Low.

Future long term geometric CITs that were calculated since the beginning of the year:
1. There are two medium Term geometric Time CITs due on exact dates in July 2013.
2.  There is a long term geometric CIT, covering decades that project a certain date in August 2013 that should be an important High or Low.
3. There is a long term geometric CIT due in September 2013 as well.

What’s next short term?


The yellow vertical lines in the chart above are the last 13 Option expiration weeks, which has a generally neutral to bullish bias, with 4 down and 9 neutral to up. Also note Option Expiration weeks often mark short term Highs or Lows as shown by the arrows on the chart. At times, the High or Low arrives 1 day before or after OE week.


There is a 5/20 geometric and 5/21 Solar CIT that should most likely result in a 5/20-21 short term High. The 6 Lunar Month Cycle chart above supports a 5/20 CIT. It is possible we rally into the upper channel resistance at 1678-80 SPX.

Everyone needs valuable Time and Cycle techniques in their toolbox to make smarter and more profitable Investments decisions.

Sunday, May 5, 2013

Mars and the Demon

http://www.safehaven.com/article/29727/mars-and-the-dragon


In Vedic Astrology, there's an ancient Demon (Swarbhanu) that was split in a
fierce battle into two parts, the upper half of the demon's Body, Rahu
is the Moon's ("True") North Node and the lower half of the body is
Ketu, the Moon's South Node, which causes the Solar and Lunar Eclipses.

Whenever these malefics Nodes comes into a hard angles (0, 90, 180,
270 degrees) aspect with another big malefic, Mars, the planet of War,
it often produce some intense and violent conflicts and Change in Trends (CIT).

Some examples of Mars Rahu aspects from the past:
Mars squares Rahu: between 7/4/90 and 8/20/90, exact aspect was on
7/23/90. The market declined from 7/13/90 into 8/23/90.
Mars squares Rahu: Between 9/20/97 and 10/30/97, exact aspect was on
10/25/97. The market declined from 10/8/97 into 10/28/97.
Mars conjuncts Rahu: Between 9/27/98 and 11/17/98, exact aspect was
on 10/8/98. The market declined from 9/24/98 into 10/8/98.
Mars squares Rahu: Between 10/25/00 and 12/13/00, exact aspect was
on 11/29/00. The market declined from 11/6/00 into 12/21/00.

Here are some examples in the recent years, most were important CITs:


Mars 180 Rahu 07/23/2011 17:31=> 7/21/11H, crash into 8/9/11L
Mars 090 Rahu 12/13/2011 06:12  => 12/19/11 major Low+6
Mars 090 Rahu 03/19/2012 18:30  => 3/27/12 major High+8
Mars 090 Rahu 04/30/2012 23:30  => 5/1/12 High+1
Mars 000 Rahu 10/02/2012 15:06  => 10/5/12 High+3
Mars 090 Rahu 01/24/2013 19:48  => Miss
Mars 180 Rahu 05/13/2013 05:46 => coming up!

The Mars opposite Rahu (Moon's North Node) Crash Cycle
.
1. Mars opposite Rahu: between 9/25/29 and 11/7/29, exact aspect was on 10/24/29. The market crashed into 10/11/29 into 10/29/29
2. Mars opposite Rahu: between on 9/29/87 and 10/30/87, exact aspect was on 10/12/87. The market crashed from 10/2/87H into 10/20/87L.
3. Mars opposite Rahu: between 8/25/01 and 10/18/01, exact aspect was on 9/14/01. The market crashed from 8/27/01 into 9/21/01L.

Notice that in the 3 examples above, the Mars Opposition Rahu played a direct role in the 3 biggest Crashes of the last Century.

Ma opposite Rahu (exact) = 9/14/01! = 10/12/87! = 10/24/29!

The statistical odds that this was due to chance is very low.

Here is the last 10 years of Mars opposite Rahu aspects, notice that 3 of the 7 Mars opposite Rahu aspects resulted in sharp declines.

Mars 180 True Node 09/14/2001 11:23 => crashed into 9/21/01L
Mars 180 True Node 01/27/2003 22:53
Mars 180 True Node 11/14/2004 08:04
Mars 180 True Node 09/01/2006 03:20
Mars 180 True Node 06/15/2008 02:32 => crashed into 7/15/08L
Mars 180 True Node 10/09/2009 19:05
Mars 180 True Node 07/23/2011 17:34  => crashed into 08/09/11L

The next Mars opposite Rahu cycle is due on 5/13/13. 
This date is supported by a long term geometric CIT due on 5/14, so we should see an important 5/13-14 CIT. Ofcourse, there are many Mars opposite Rahu aspects, which is a 1-2 year cycle, but actual crashes are rare events and odds are relatively low, but you still need to be aware of this potential Crash Cycle in the May 2013 Month.

A word of caution: The purpose of this article is not to make people fearful and no one should depend on any crashes to make money and they certainly should not trade on this information alone. Currently, all trends are up, the markets are bullish and trading against the trend is like swimming upstream. What I do suggest is take the time to study the statistical data presented, you might find it a very valuable tool.

Wednesday, May 1, 2013

WSJ: The American Heart Association recommends the Transcendental Meditation technique above all others

According to the American Heart Association, the Transcendental Meditation technique (http://www.tm.org/) is the only meditation practice that has been shown to lower blood pressure, which substantially reduced rates of death, heart attack and stroke. Other meditation or relaxation techniques have not given these results.

http://online.wsj.com/article/PR-CO-20130501-909027.html?mod=googlenews_wsj