Tuesday, February 2, 2021

Last gasp rally phase?


We have had some wildly volatile couple of weeks recently.

From the 1/29 Raj T&C Update: "The 1/27-28 quadruple time Cluster was a 1/26H and a possible 1/29L today... The 39 TD Cycle in the Emini SP (see chart) suggests a 1/29-2/1L".

Actual: We made a 1/29L in the SPX Cash and 2/1L in the Emini SP futures and have now started a last gasp rally phase.


What's next: From the 1/29L, various proprietary active cycles are expecting a last gasp rally and the coming High could be the High of the Year. 

If these cycles are correct, time is running out as a giant bubble is about to pop. 

As they say, may we live in interesting times.


Join our free forecasts and Updates at: 

Tuesday, January 5, 2021

Intraday Time and Cycles for Jan 5 2021

We need a follow through delcine to confirm the Jan 4 Highs.


The intraday 5 min SPX Time CIT 01/05/20: 10.45, 11.25, 11.50, 1.45, 3.05 pm Eastern

Actual: 10.45L, 11.15L

The intraday cycle sees a 1st hour High, midday High and last hour High

Intraday Cycle are the Pink lines: (9.40L), 10.00H, 11.00L, 12.30H, 2.30L, 3.50H

Actual: 9.30L, 10.05H, 11.15L

Monday, January 4, 2021

January 4 2021 is our next Time and Cycle High


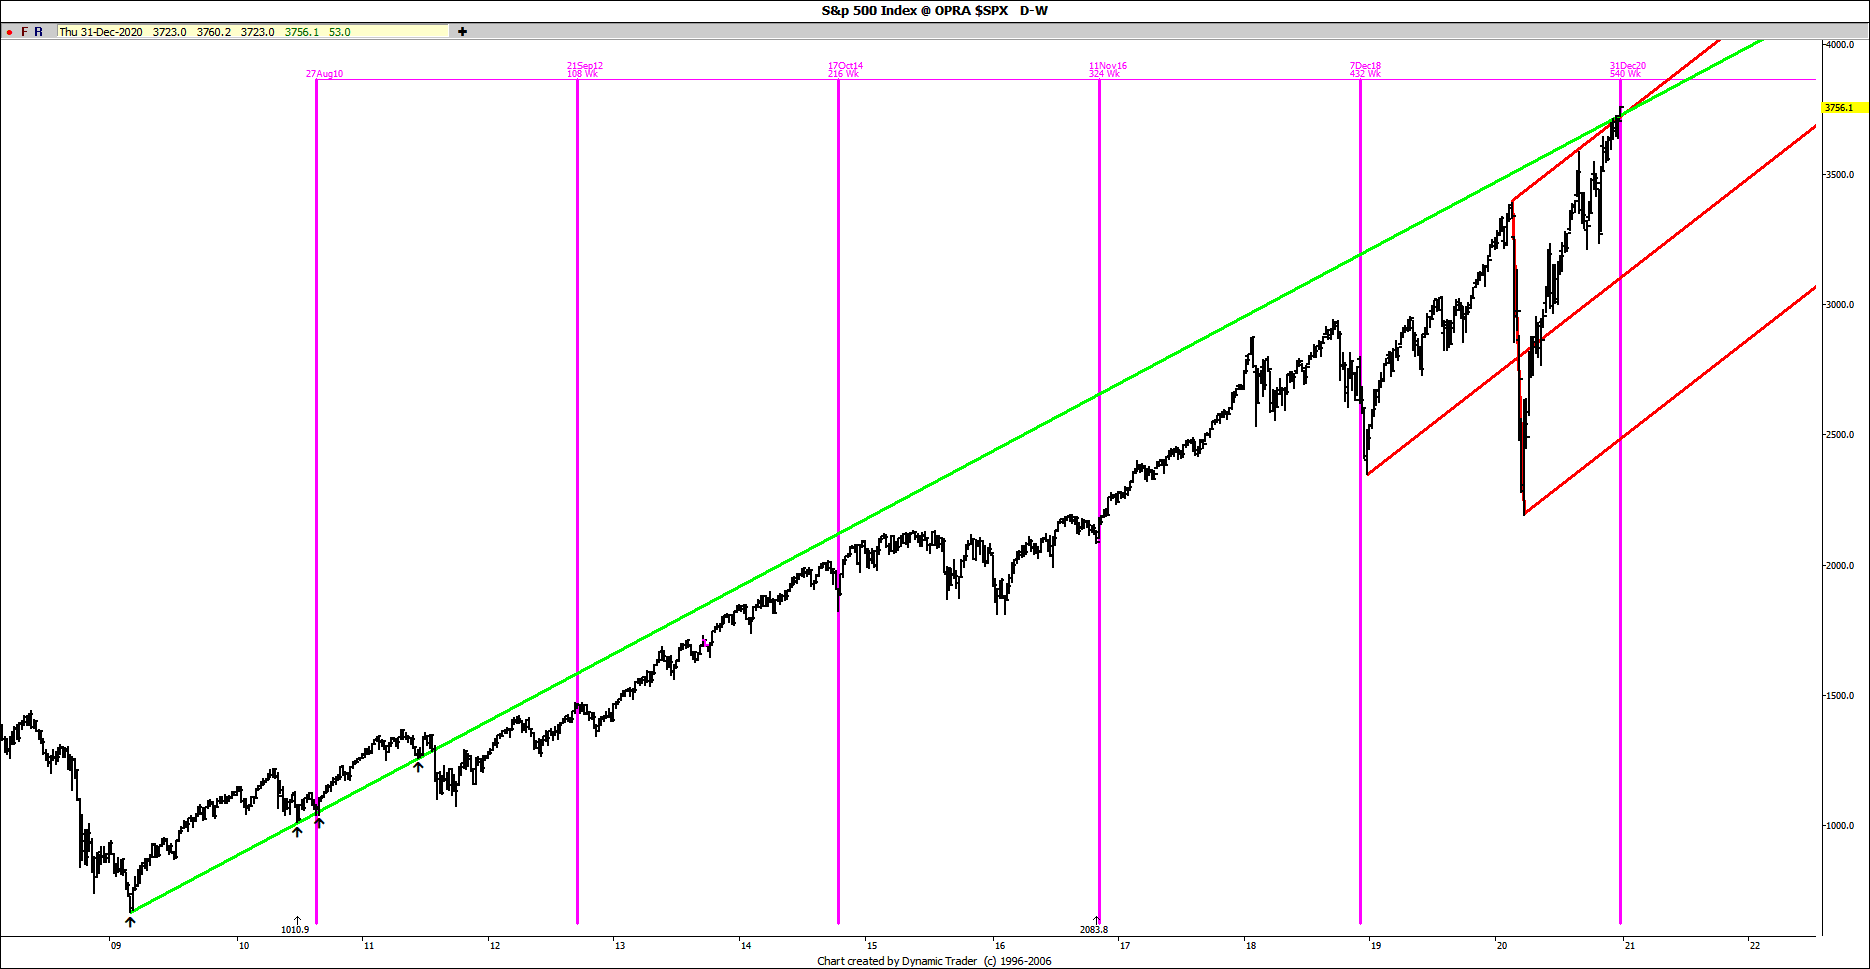
The SPX gapped higher to fresh All time Highs at the opening 9.30 High at 3769.99 SPX today, right at our outstanding 3760-65 SPX Triangle target we had for many weeks, reversed a sharp 107+ SP to a 12.15 Low at 3662.71 SPX and closed lower, down -55.42 at 3700.65 SPX. 

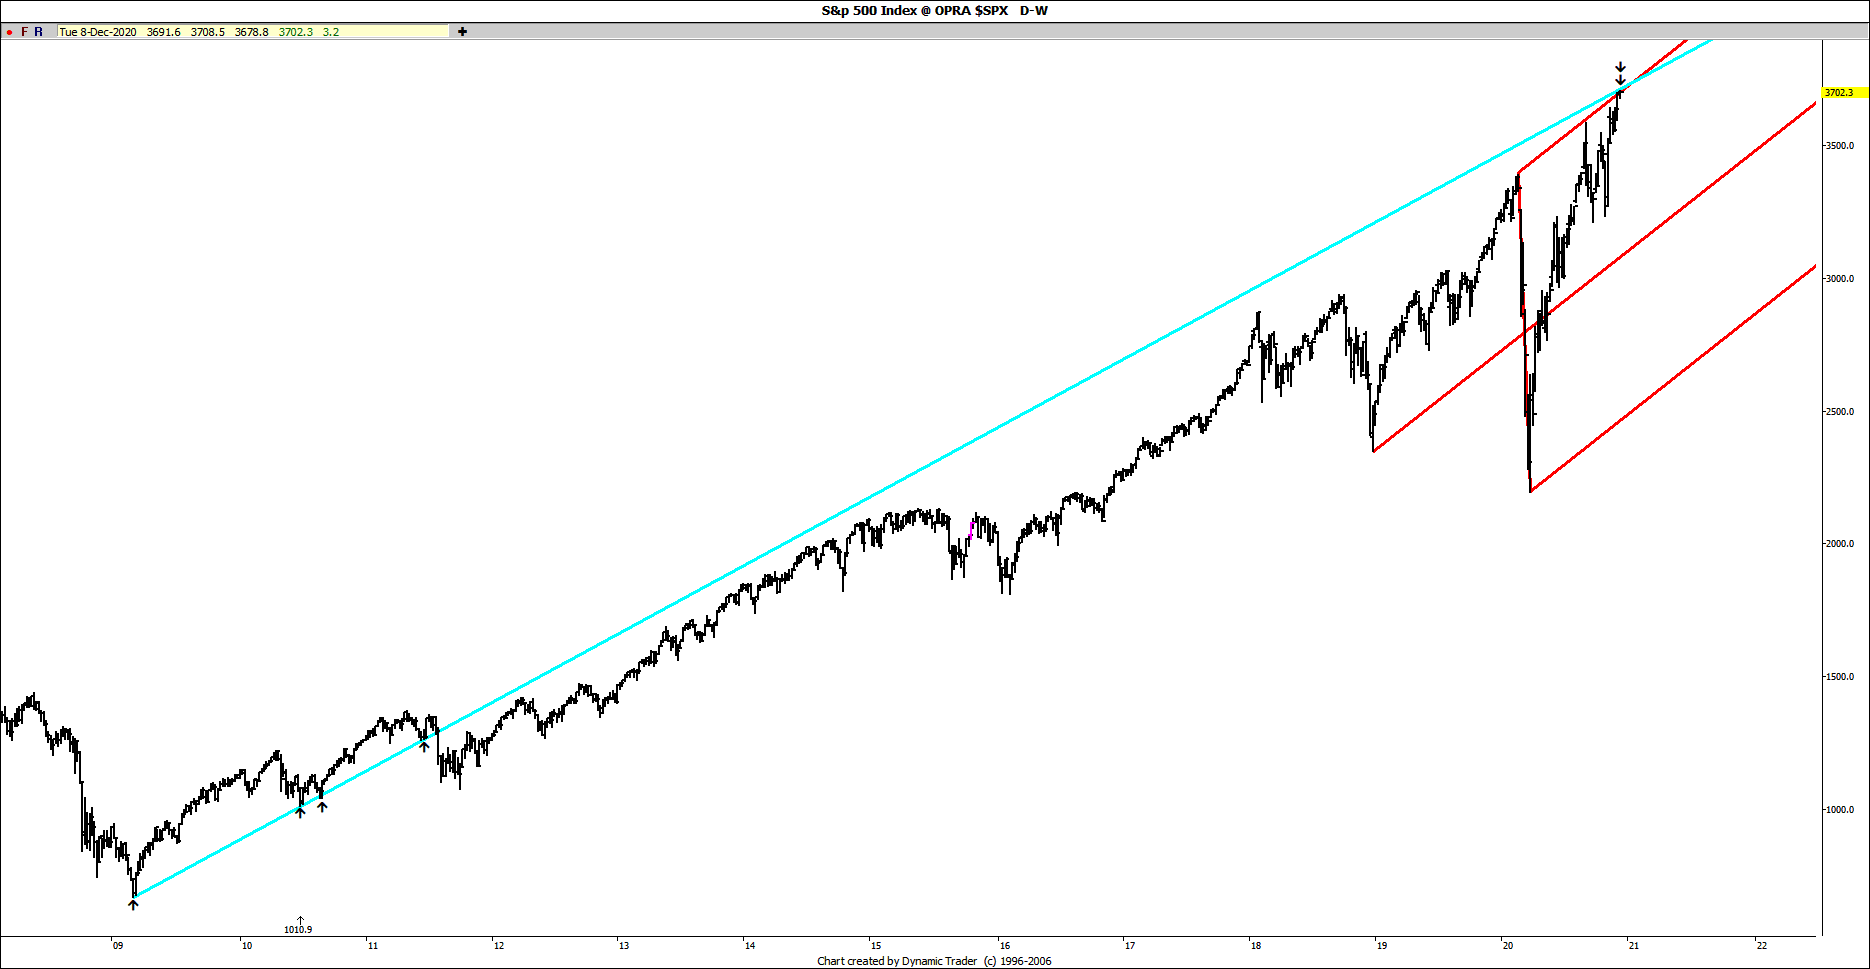
Time CITs: We rallied into the 12/31 Geometric & 1/02 Solar time CIT, suggesting we saw a 1/04/21 High, right at the Open and we saw a sharp intraday reversal and close lower to confirm, closing back below key Fork and LT Trendline resistance at 3730 SPX. 

Cycle CIT: The 108 week cycle (see above chart) was due 12/31/20, but has a variance of a few weeks, and may well be today’s 1/04/21H, right at the projected 1/05/21H+/-1.

12/31/20:108 week+/-1 wk Cycle: 8/27/10L - 9/14/12H - 10/15/14L - 11/08/16L – 12/5/18H-2- 12/31/20 +/-1 week. 

What's next: We confirm the 1/04/21 swing High and see a continued decline into the next Time and Cycle cluster.


Covid special Subscription discounts are found here: 


Join

Join our free forecasts and subscribe at: 


Thursday, December 17, 2020

12/17-18 is the next swing High

In our 11/27 public Post, the next T&C Cluster was centered on 11/30 and was biased to be High.

Actual: The 11/30 T&C Cluster inverted to a 11/30 Low.


From 12/10 Raj T&C Daily Email: "The cycle bias is we see a 12/10L and we now rally into 12/17H at the 12/15+/-2 Long term Geometric time CIT and 12/17 Solar time CIT"

Actual: We made a 12/11L and have now rallied into today's 12/17 proprietary 12/17 Solar time CIT, right at long term Trend line and Fork resistance.

Whats' Next: We see a 12/17-18H at the 12/17 Solar and 12/18 double Geometric short term time CIT and start a next decline into XXX T&C Cluster Low.


Join our free forecasts and Updates at: 

Wednesday, December 9, 2020

Friday, November 27, 2020

You are here: 11/30 High

 From the 11/5 Public Blog: “We should make a 11/6-9 swing High, before the next decline. There are 3 more important T&C (Time and Cycles) Clusters remaining in November that should be crucial to watch in the coming weeks.”

From 11/8 Raj T&C weekend Report: “Ideally we see an 11/6-9H at the 11/7 weekend Solar time CIT at the 9 TD cycle and a 47/94 TD Cycle due 11/9H. We then see a brief decline into 11/12-13L”

Actual: We made a 11/9H (#1 on chart) and declined into 11/12L (#2) at the 11/12 double Geometric time CIT.


From 11/15 Raj T&C weekend Report: “We have rallied into 11/15 weekend Geo time CIT suggesting a 11/13-16 short term High…If Globex futures are higher, we should see a 11/16H, with a decline into 11/19L at the 11/19 Geo time CIT”

Actual: From 11/12L, we rallied into 11/16H (#3) and declined into 11/19L (#4).  

From 11/20 Raj T&C Daily Update: “We saw a last hour Low today, so Monday 11/23 Solar time CIT will be a 11/23 Low (#4) and we rally into 11/27-30 T&C Cluster High (#5), which includes a Lunar Eclipse”

Actual: We made a 11/23L (#4) and are now rallying into 11/27-30 High (#5)

What’s Next: We should see a 11/30 swing High and start the next decline.


The 11/30 T&C Cluster includes:

1. 11/27-30 double Geo time CIT 

2. 12/1 Solar time CIT

3. 12/1 is  69 Squared weeks from the 9/3/29H (see table below) 

4. 11/29 is the fibonacci 1618 CD cycle from 10/8/98L 

5. 12/1 is the next 9 TD Cycle


11/29: 4.5 Yrs/1618 CD/231 wk Cycle: 10/8/98L-1616-3/12/03L-1618-8/16/07L-1618-1/20/12L (miss)-1618- 6/25/16L-1618- 11/29/20


9/3/29H +

55 Squared weeks = 08/25/87H

56 Squared weeks = 10/10/89H

57 Squared weeks = 12/10/91

58 Squared weeks = 02/22/94H

59 Squared weeks = 05/21/96H

60 squared weeks = 09/01/98L(-308 = 10/28/97L)

61 squared weeks = 12/26/00H

62 squared weeks = 5/6/03

63 squared weeks = 9/27/05

64 squared weeks = 3/04/08 (+308 = 1/06/09H)

65 squared weeks = 8/24/10L+2

66 squared weeks = 2/26/13L (+308 =12/31/13H)

67 squared weeks = 09/15/15H+2 (+308 = 7/19/16+1H)

68 = 4/17/18H+1

69 = 12/01/2020

9/3/29H+69 Squared weeks = 12/1/20.


We should see a 11/30+/-1 swing High.


Join our free forecasts and Updates at: 

Wednesday, November 18, 2020

US$ Dollar Watch


The US$ Dollar is at critical support levels at 91.75.

US$Dollar time CITs: 11/30, 12/11 & 12/24** is major.

Thursday, November 5, 2020

You are soon here: 11/6 High

 In our last blogpost, we were looking for an 10/23 lower High.

From 10/23 Raj T&C (Time & Cycles) Daily Email: “The 10/24 weekend Solar time CIT (Change in Trend) sees an 10/23-26H, decline into 10/27 Geo Time CIT, brief rally into 10/29 Geo time CIT and decline into 10/30-11/2L at the 10/31 weekend Geo time CIT”

Actual:  From the 10/23 swing High, we declined into 10/28-29L (#1 on chart), saw a brief bounce into 10/29H (#2) and declined into 10/30 (#3) swing Low.


From 10/31 Raj T&C weekend Report: “Statistics suggests an 80-85% probability we see a 11/4 close > 3391-3401 SPX. From 10/30-11/2L, we see a volatile rally into 11/6-9H at the 11/7 Solar time CIT”

Actual: From the 10/30 swing Low, we are seeing a sharp rally above 3401 SPX into 11/5 (#5) so far. The sharp rally above the 10/23H makes any crash wave unlikely.

What’s Next: We should make a 11/6-9 swing High,  before the next decline. There are 3 more important T&C Clusters remaining in November that should be crucial to watch in the coming weeks.


Join our free forecasts and Updates at: 

Friday, October 30, 2020

You were warned in advance

  "10/23H was right at the down channel resistance and it could trigger the Mother Divine (MD) Crash Cycle, where the last day of MD (10/24) is a High and we start a crash wave, be alert for this possibility."


and those that studied this Mother Divine Cycle carefully from previous posts on it, knows exactly when the Crash Low should occur...It isn't over until it is over.


Sunday, October 25, 2020

The Mother Divine Crash wave starts with an 10/23 lower High

In our last public 9/25 post we were looking for a 9/24-29 swing Low.

Actual: We saw a Sep 24 swing Low at 3209.50 SPX. We have since rallied a sharp 340.40 SP's to an 10/12 High.


Forecast from the 10/3 Raj Time and Cycles (T&C) Daily Email (3 weeks ago): "From 10/1H, decline briefly into 10/2-5L at the 10/3 Solar & 10/2-5 Geo time CIT. We will rally into 10/9-12 T&C cluster High, decline into 10/16-19L"

Actual: We made an 10/1H (#1 on chart), declined briefly into 10/2L (#2), rallied into 10/12H (#3), which was along term Geometric time CIT and declined into 10/19L (#4).

Forecast from 10/19 Intraday Update: "If today 10/19 was a High, we could see an 10/21-22 Low and 10/26 High"

Actual: We declined into 10/22L (#5) at the wedge Apex CIT and are now rallying into 10/26H.

What's next: The coming week should continue to be volatile as we see another short term 10/23 High at the 10/24 weekend Solar Time CIT. 

The 10/24 Solar time CIT, along with the 10/24 Midpoint CIT of Mercury Retrograde and Direct, Venus Debilitated in Virgo on 10/23 and the last day of 9 days of "Mother Divine" (MD) CIT on 10/24 was the 10/23 lower High.

10/23H was right at the down channel resistance and it could trigger the Mother Divine (MD) Crash Cycle, where the last day of MD (10/24) is a High and we start a crash wave, be alert for this possibility.

It is a little esoteric but here is the Mother Divine crash wave Research link:


For more detailed charts: http://timeandcycles.blogspot.com/


Happy Victory Day! 💥


Join our free forecasts and Updates at: 
Friday, October 9, 2020

The "Brahma Muhurta" is the most powerful time of the day


 In Vedic traditions, the day starts at Sunrise and ends at the next sunrise. A Muhurta is a Vedic unit of time that is equal to 48 minutes.  Every day then has 30 muhurtas as 30 X 48 minutes = 1440 minutes = 24 hours = 1 day.The Brahma Muhurta starts 2 muhurtas or 96 minutes (about 1 1/2 hours) before sunrise. 

Literally meaning "The Creator's Hour", it is considered an auspicious time for all practices of yoga and most appropriate for meditation, worship or any other religious practice. Spiritual activities performed early in the morning have a greater effect than in any other part of the day. Each muhurta lasts 48 minutes, and therefore the Brahma muhurta begins 1 hour and 36 minutes before sunrise, and ends 48 minutes before sunrise. 

The time of sunrise varies each day, according to geographic location and time of year, thus the time of the Brahma muhurta also varies. For example, if sunrise is at 6am, the brahma muhurta begins at 4:24am. If sunrise is at 7am, brahma muhurta begins at 5:24am, and so on. 

Brahma muhurtha occurs during the "Vata" phase of the morning, between 2:00am and 6:00am, and Yoga masters state that the best time to meditate is one and a half hours before dawn, because the mind is inherently still at that time, enabling one to achieve a deeper meditative state.


Friday, October 2, 2020

Will we see an October 2020 Panic?


Many wonder why October has often been volatile as we had many historic crashes in October, including 1847, 1857, 1907, 1929, 1937, 1987, 1990, 1997, 2002 and more recently in October 2008 and 2018, to name a few.

The actual hidden reason that October is often "panicky" is that in Vedic Astrology the Vedic Sun, which represents the Self and Self Confidence, is debilitated in Libra every year between Mid October and Mid November. This lack of confidence in the markets often shows up as Panics and crash waves.

In addition, to add fuel to the fire this year:

1. Mars, the planet of War, arguments and aggression is retrogade the whole month of October 2020 (9/9-11/13).

2. Mercury, the planet of Business, communication and trade is retrograding from 10/14 through 11/3.

3. The uncertainty and divisiveness around the USA elections from now into 11/5 is certainly not helping.

4. Venus is debilitated in Virgo from 10/23 through 11/16

5. The "Mother Divine" Crash Cycle could get activated as it is also due in October-November 2020.

I have written about the potential Mother Divine Crash cycle in the past.

Have your popcorn ready as it should be interesting to watch this month unfold.


Join our free forecasts and Updates at: 

Friday, September 25, 2020

September 24-29 Time and Cycles Cluster Low

 From the 9/12 Raj T&C Weekend Report: "We should see a 9/11L or as late as 9/14L at the 9/12 Solar time CIT, rally into 9/16 Geo Time CIT High, before we decline into 9/22-23 Geo and 9/23 JPTL CIT, targeting the 3200-3230 SPX area" 

Actual: We saw a 9/11L (#1 on chart), rallied into 9/16 proprietary Geometric time CIT High(#2)  and declined into 9/24 Low (#3) at 3209.45 SPX so far.

What's Next: From the 9/23-24 most recent Updates: "Swing traders that were short from 9/16 Geo time CIT High, should take some profits yesterday and today as we are in the window of the 9/24-28 cycle Low."..."The 9/22-23 double Geo & Apex CIT could have seen a 9/23L, but  more likely we saw a 9/23H and reversal lower and we are now down in a sharp C wave into 9/28-29L at the 9/26 Solar weekend and at the 9/29-30 triple Geometric time CIT. Support remains 3200 SPX+/-20, but any decline below 3182.60 SPX confirms a larger C wave decline targeting 3100 SPX area. "


Join our free forecasts and Updates at: 

Friday, September 18, 2020

Intraday Time and Cycles for Sep 18 2020


Pink lines is the normal path of the High am to Low pm day

Green lines is the inverted cycle, ie a Low am to High pm day


The intraday 5 min SPX Time CIT 09/18/20: 9.35, 10.35, 11.00, 2.35 pm Eastern


Intraday Cycle are the Pink lines: (9.40L), 10.30H, 12.30L, 1.30H, 3.30L