3/23/20L Trendline was key resistance in the Russel, Tesla and Bitcoin,
something to watch closely
something to watch closely


Conclusion: We rallied into long term channel resistance at 2720-50 SPX and into the 18 wk and 75 wk Flash Crash cycles due to top out now or in the coming week+/-.
The 9 days of Mother Divine (MD) was on 10/6-15.
The MD Crash Cycle, IF active, suggests a secondary 10/15H and a crash wave into the NM–2 = 11/3L.
The Flash Crash 75 week cycle, if active suggests a crash Low due 11/5L.
Here is some more info on the crash History of the 9 Days of Mother Divine http://timeandcycles.blogspot.com/2008/04/crash-history-of-9-days-of-mother.html
Here is some more info on the Flash Crash 75 week cycle: http://timeandcycles.blogspot.com/2013/04/the-flash-crash-cycle.html
The NDX Master Cycle (MC) gets precedent above all other cycles. It recently predicted an 10/11L(+1) and the rally into 10/15H+/-. The MC has its own unique path,which I will update this weekend for members.

Next Time CIT (Change in Trend) to watch 10/6-7:
Forecast 1: From 9/17 Raj T&C weekend report: "We declined into a T&C Cluster and right at the 21 TD Cycle of Lows due 9/17L+/-1, suggesting a 9/17-20L, then rally into 9/26-27 Solar and Geo time CIT."
Actual: We made a 9/20L and rallied 160+ SP's into 9/24 swing High, at the 9/26 weekend (9/24-27) Solar & 1 day before the 9/27 Geometric time CIT.

Forecast 2: From the 9/25 Raj T&C weekend report: "From the 9/24H, we decline into 9/30-10/1L at the 9/30 Geo and 10/3 Solar weekend CIT"
Actual: From the 9/24H, we have declined 160 SP's into 9/30-10/1 as expected and should now see a rally next week.


Similarly, NDX and Bitcoin (see previous post) is declining into Bitcoin's 9/9-10 proprietary triple Geo Time CIT, suggesting a Time and Cycles swing Low being made.

1. The 3/13/20 red Trendline acted as Key resistance at the recent 9/6/21 swing High, the 70.7% retrace.
2. The other trendline will act as Trendline support around 39485, close to the 55% retrace.
3. The pink vertical lines are proprietary Geometric Time CITs (Change in Trend = High or Low) and we are declining into 9/9-10 triple Geometric Time Cluster, suggesting a 9/10 swing Low.
4. The 68 TD Cycle last saw the 1/8/21 High, 4/14/21 High and 7/20/21 swing Low is next looking for an 10/21 High or Low, right at the 10/22 Geo Time CIT.
 |
5. The proprietary NDX Master Cycle remains active. It recently projected a 9/7-8H and we saw a 9/7 NDX High and is now looking for a sharp decline into 9/10 swing Low, supporting the above Bitcoin outlook.


 The weekly SPX is in a long term rising wedge.


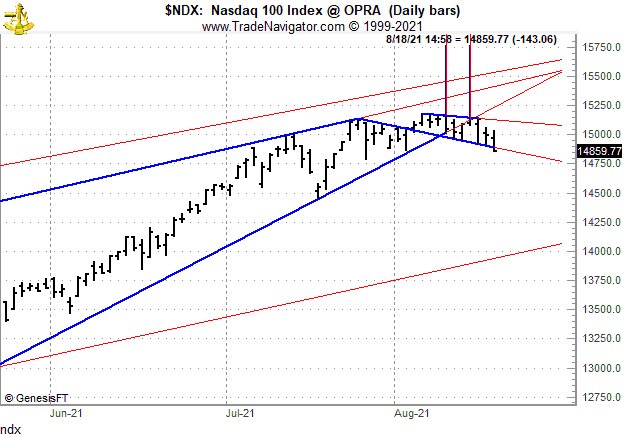
I had a long term proprietary Geometric Time CIT (Change in Trend) going back to the 1/26/18 High that was due on 8/13/21 which was a direct hit and this long term 8/13 Geo time CIT occurred right at the 8/13 Master Cycle High, iow 8/13H was one of those unique signature potential fortune making T&C Clusters.
 |
What's next: We rally into an 8/11-13 swing High and see a relatively sharp decline afterwards.